
#LINK
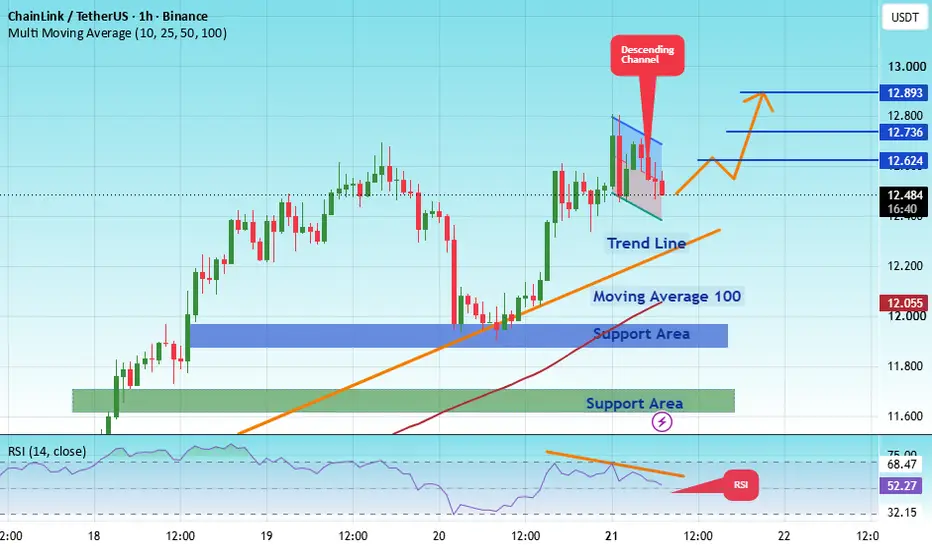
The price is moving within a bearish channel on the 1-hour timeframe; it has reached the lower boundary and appears poised for a rebound, suggesting a potential upward move upon retesting this level.
The Relative Strength Index (RSI) indicates a bearish trend, but an upward breakout is likely due to oversold conditions on the 1-hour chart.
An orange trend line supports the potential upward rebound.
There is initial support at 11.89, acting as a primary support zone.
A key support zone (marked in green) exists at 11.60; the price has rebounded from this area multiple times, making it a strong support level.
The price is moving toward the 100-period moving average—a level we are currently approaching—which supports the bullish outlook.
Entry Price: 12.50
Target 1: 12.62
Target 2: 12.73
Target 3: 12.89
Stop Loss: At the green resistance zone.
Remember this simple rule: Capital management.
If you have any questions, please leave a comment.
Thank you.
Dagangan ditutup: sasaran tercapai
#LINK
Target 1: 12.62 Reached
Target 2: 12.73 Reached
Target 3: 12.89 Reached

📍Trade Smart & Stay Protected⭐️
Join Our Telegram Channel Signals Futures and Spot Free
👉 t.me/+WN4RexVn8DM2MTlk
📌 We're open to Promotions, Ads & Partnerships
Join Our Telegram Channel Signals Futures and Spot Free
👉 t.me/+WN4RexVn8DM2MTlk
📌 We're open to Promotions, Ads & Partnerships
Penafian
Maklumat dan penerbitan adalah tidak bertujuan, dan tidak membentuk, nasihat atau cadangan kewangan, pelaburan, dagangan atau jenis lain yang diberikan atau disahkan oleh TradingView. Baca lebih dalam Terma Penggunaan.