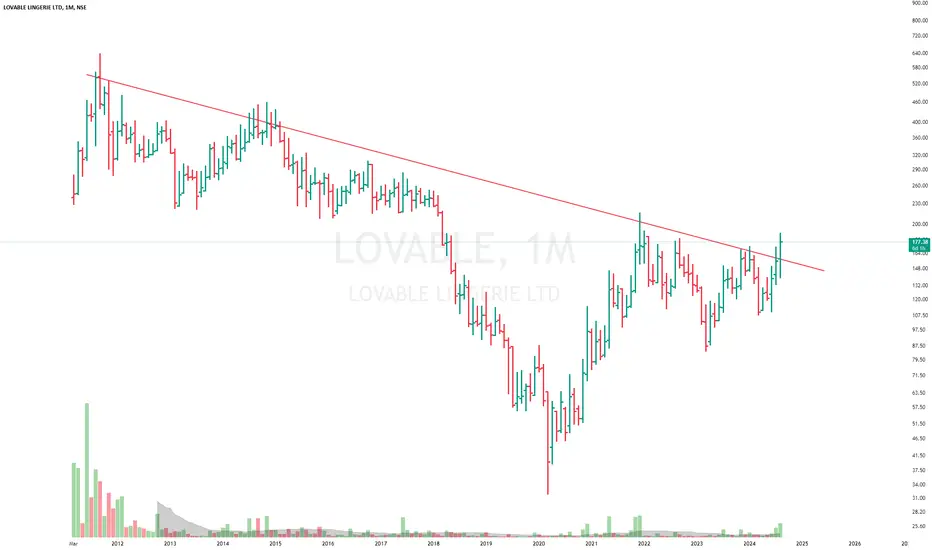
 LOVABLE has broken out from a multi-year downward sloping trendline.
 Structure looks like inverted H&S though I would avoid calling it as I prefer to go by strict technical definition of H&S which says inverted (or bullish) H&S should form after a decline since it's a trend reversal pattern. Decline is there but the whole decline is in form on H&S instead of H&S formed after a decline. Anyhow it's just a technicality and we can treat it as a breakout. Feel free to call it a trendline BO or H&S BO.
As for target, technical target should be above 700 as per the height of structure. However, I would prefer to trade it with multiple smaller targets. I would look for 300 as the next major then will wait for price action to confirm if it would go further and target would be 400. Next would be 550 and then 700.

True Wave Scanner - scanner.elliottwavestrading.com
Penafian
Maklumat dan penerbitan adalah tidak bertujuan, dan tidak membentuk, nasihat atau cadangan kewangan, pelaburan, dagangan atau jenis lain yang diberikan atau disahkan oleh TradingView. Baca lebih dalam Terma Penggunaan.
True Wave Scanner - scanner.elliottwavestrading.com
Penafian
Maklumat dan penerbitan adalah tidak bertujuan, dan tidak membentuk, nasihat atau cadangan kewangan, pelaburan, dagangan atau jenis lain yang diberikan atau disahkan oleh TradingView. Baca lebih dalam Terma Penggunaan.