
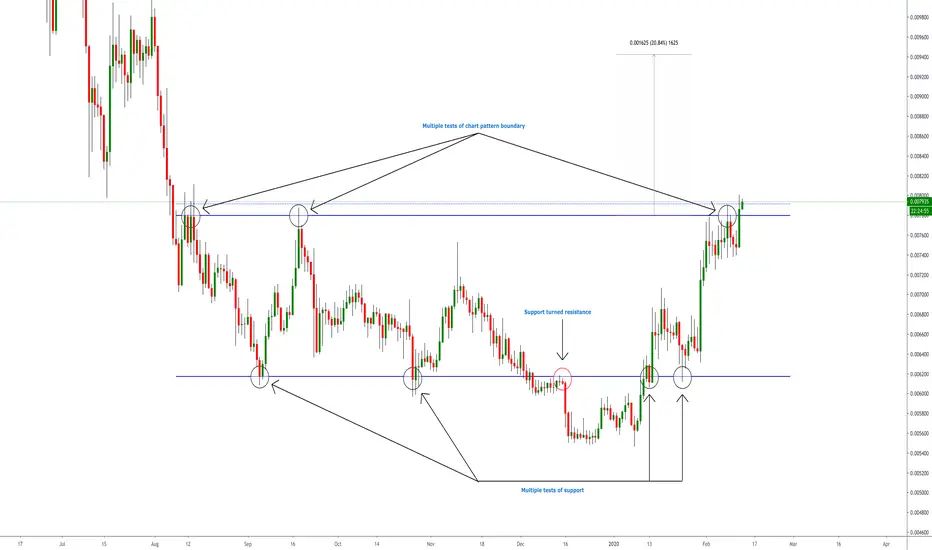
In this chart we're looking at LTCBTC on the 1D chart as price has consolidated into a rectangle. Price has broken through the horizontal boundary at 7799. A breakout will be confirmed once price prints a 1D candle above the 7916 price line. I love to see price consolidate right below the chart pattern boundary before breakout occurs. This gives a great area to look to place a stop loss; offering a solid risk/reward ratio for this setup.
This rectangle has a price target of around 9425 for about a 21% gain.
I think a small pullback is probable once breakout is confirmed. If this happens, I will be looking for entry around the chart pattern boundary.
If you would like to see more of these ideas on a regular basis, follow me as I will be posting many more exciting chances to earn on chart pattern breakouts this upcoming year!
Like or comment if you found this idea interesting or helpful in any way!
Cheers!
This rectangle has a price target of around 9425 for about a 21% gain.
I think a small pullback is probable once breakout is confirmed. If this happens, I will be looking for entry around the chart pattern boundary.
If you would like to see more of these ideas on a regular basis, follow me as I will be posting many more exciting chances to earn on chart pattern breakouts this upcoming year!
Like or comment if you found this idea interesting or helpful in any way!
Cheers!

Penafian
Maklumat dan penerbitan adalah tidak bertujuan, dan tidak membentuk, nasihat atau cadangan kewangan, pelaburan, dagangan atau jenis lain yang diberikan atau disahkan oleh TradingView. Baca lebih dalam Terma Penggunaan.
Penafian
Maklumat dan penerbitan adalah tidak bertujuan, dan tidak membentuk, nasihat atau cadangan kewangan, pelaburan, dagangan atau jenis lain yang diberikan atau disahkan oleh TradingView. Baca lebih dalam Terma Penggunaan.