MATIC/BTC 1D Short Term
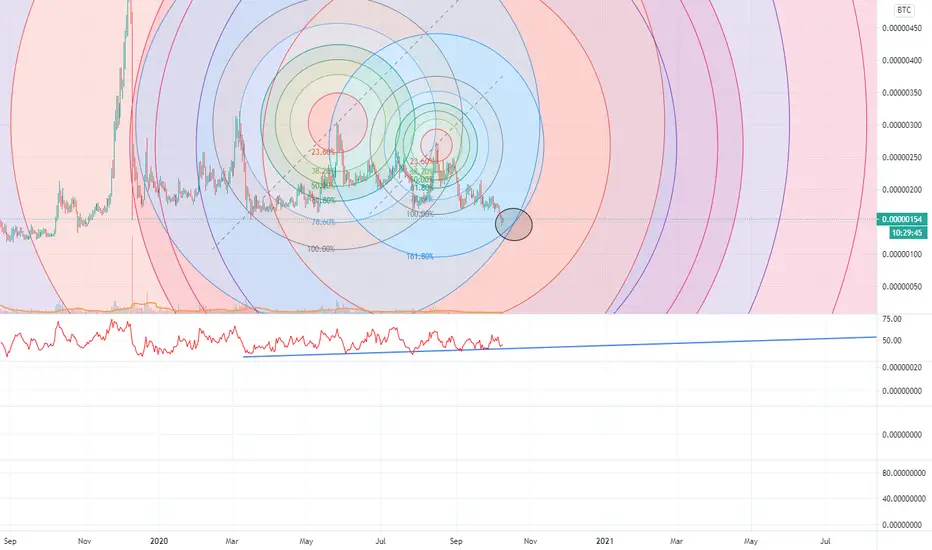
Short term we will drop to 140 sat area, see dark circle that indicates a support/resistance area. After that a rise is possible back to 170 sat area for the first target.
Also see the ultimate oscillator here. The line below the indicator indicates a last drop back to the line, before rising again.
No advice from me, i just look at the charts :)
Also see the ultimate oscillator here. The line below the indicator indicates a last drop back to the line, before rising again.
No advice from me, i just look at the charts :)

Penafian
Maklumat dan penerbitan adalah tidak bertujuan, dan tidak membentuk, nasihat atau cadangan kewangan, pelaburan, dagangan atau jenis lain yang diberikan atau disahkan oleh TradingView. Baca lebih dalam Terma Penggunaan.
Penafian
Maklumat dan penerbitan adalah tidak bertujuan, dan tidak membentuk, nasihat atau cadangan kewangan, pelaburan, dagangan atau jenis lain yang diberikan atau disahkan oleh TradingView. Baca lebih dalam Terma Penggunaan.