Polygon (MATIC) - August 9
hello?
Welcome, traders.
By "following", you can always get new information quickly.
Please also click "Like".
Have a good day.
-------------------------------------
(MATICUSDT 1M Chart)

The key is whether the price can be maintained above the 0.6164-0.8191 range.
(1W chart)

We need to see if the MS-Signal indicator can turn into an uptrend.
For that to happen, the key is to keep the price above 0.8191.
- The Stoch RSI indicator is entering the overbought zone.
As such, it is important to find support at or above the 0.6164-1.8191 range when it breaks out of the overbought zone.
(1D chart)
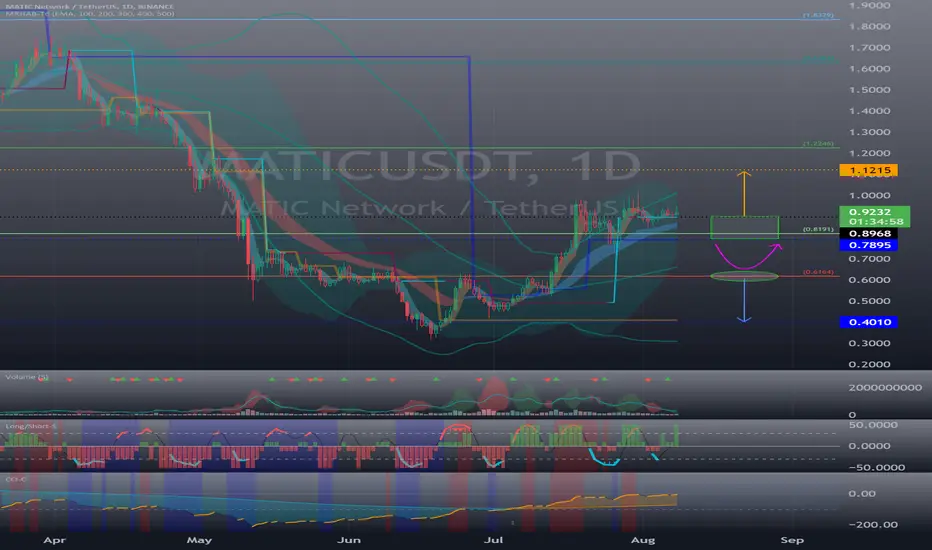
Resistance: 1.1215-1.2246
1st support: 0.7895-0.9223
2nd support: 0.6164
You should see support near the 0.7895-0.9223 section and see if you can climb.
The 0.6164-0.8191 interval is the interval that determines the trend.
Therefore, if it is supported by falling to the 0.6164-0.8191 section, it is expected to rise.
When it falls below 0.6164, Stop Loss is required to secure cash.
------------------------------------------------------------ -------------------------------------------
** All descriptions are for reference only and do not guarantee a profit or loss in investment.
** The MRHAB-T indicator, which is inactive on the chart, contains indicators that indicate support and resistance points.
** Background color of Long/Short-S indicator: RSI oversold and overbought sections
** Background color of CCI-C indicator: When the short-term CCI line is below -100 and above +100, oversold and overbought sections are displayed.
** The OBV indicator was re-created by applying a formula to the DepthHouse Trading indicator, an indicator disclosed by oh92. (Thanks for this.)
(Short-term Stop Loss can be said to be a point where profit and loss can be preserved or additional entry can be made through split trading. It is a short-term investment perspective.)
---------------------------------
Welcome, traders.
By "following", you can always get new information quickly.
Please also click "Like".
Have a good day.
-------------------------------------
(MATICUSDT 1M Chart)
The key is whether the price can be maintained above the 0.6164-0.8191 range.
(1W chart)
We need to see if the MS-Signal indicator can turn into an uptrend.
For that to happen, the key is to keep the price above 0.8191.
- The Stoch RSI indicator is entering the overbought zone.
As such, it is important to find support at or above the 0.6164-1.8191 range when it breaks out of the overbought zone.
(1D chart)
Resistance: 1.1215-1.2246
1st support: 0.7895-0.9223
2nd support: 0.6164
You should see support near the 0.7895-0.9223 section and see if you can climb.
The 0.6164-0.8191 interval is the interval that determines the trend.
Therefore, if it is supported by falling to the 0.6164-0.8191 section, it is expected to rise.
When it falls below 0.6164, Stop Loss is required to secure cash.
------------------------------------------------------------ -------------------------------------------
** All descriptions are for reference only and do not guarantee a profit or loss in investment.
** The MRHAB-T indicator, which is inactive on the chart, contains indicators that indicate support and resistance points.
** Background color of Long/Short-S indicator: RSI oversold and overbought sections
** Background color of CCI-C indicator: When the short-term CCI line is below -100 and above +100, oversold and overbought sections are displayed.
** The OBV indicator was re-created by applying a formula to the DepthHouse Trading indicator, an indicator disclosed by oh92. (Thanks for this.)
(Short-term Stop Loss can be said to be a point where profit and loss can be preserved or additional entry can be made through split trading. It is a short-term investment perspective.)
---------------------------------

[Practical trading strategy using HA-MS and SBOD]
youtu.be/aceN1AttX1Y
RenkoBot automated trading has been added.
readcrypto.kr/
You can view the real-time simulated trading status of RenkoBot using Binance USDT spot pairs.
youtu.be/aceN1AttX1Y
RenkoBot automated trading has been added.
readcrypto.kr/
You can view the real-time simulated trading status of RenkoBot using Binance USDT spot pairs.
Penerbitan berkaitan
Penafian
Maklumat dan penerbitan adalah tidak bertujuan, dan tidak membentuk, nasihat atau cadangan kewangan, pelaburan, dagangan atau jenis lain yang diberikan atau disahkan oleh TradingView. Baca lebih dalam Terma Penggunaan.
[Practical trading strategy using HA-MS and SBOD]
youtu.be/aceN1AttX1Y
RenkoBot automated trading has been added.
readcrypto.kr/
You can view the real-time simulated trading status of RenkoBot using Binance USDT spot pairs.
youtu.be/aceN1AttX1Y
RenkoBot automated trading has been added.
readcrypto.kr/
You can view the real-time simulated trading status of RenkoBot using Binance USDT spot pairs.
Penerbitan berkaitan
Penafian
Maklumat dan penerbitan adalah tidak bertujuan, dan tidak membentuk, nasihat atau cadangan kewangan, pelaburan, dagangan atau jenis lain yang diberikan atau disahkan oleh TradingView. Baca lebih dalam Terma Penggunaan.