Panjang
MATIC: Pullback in Uptrend
Polygon (MATIC) technical analysis:
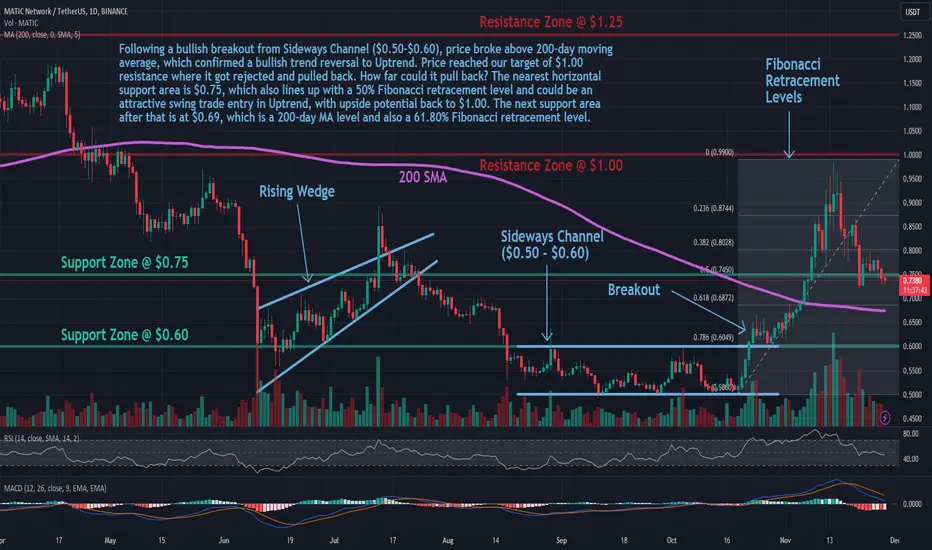
Trade setup: Following a bullish breakout from Sideways Channel ($0.50-$0.60), price broke above 200-day moving average, which confirmed a bullish trend reversal to Uptrend. Price reached our target of $1.00 resistance where it got rejected and pulled back. How far could it pull back? The nearest horizontal support area is $0.75, which also lines up with a 50% Fibonacci retracement level and could be an attractive swing trade entry in Uptrend, with upside potential back to $1.00. The next support area after that is at $0.69, which is a 200-day MA level and also a 61.80% Fibonacci retracement level.
Trend: Neutral on Short-Term basis and Uptrend on Medium- and Long-Term basis.
Momentum is Mixed as MACD Line is below MACD Signal Line (Bearish) but RSI ~ 50 (Neutral).
Support and Resistance: Nearest Support Zone is $0.75 (previous resistance), then $0.60. The nearest Resistance Zone is $1.00.
Trade setup: Following a bullish breakout from Sideways Channel ($0.50-$0.60), price broke above 200-day moving average, which confirmed a bullish trend reversal to Uptrend. Price reached our target of $1.00 resistance where it got rejected and pulled back. How far could it pull back? The nearest horizontal support area is $0.75, which also lines up with a 50% Fibonacci retracement level and could be an attractive swing trade entry in Uptrend, with upside potential back to $1.00. The next support area after that is at $0.69, which is a 200-day MA level and also a 61.80% Fibonacci retracement level.
Trend: Neutral on Short-Term basis and Uptrend on Medium- and Long-Term basis.
Momentum is Mixed as MACD Line is below MACD Signal Line (Bearish) but RSI ~ 50 (Neutral).
Support and Resistance: Nearest Support Zone is $0.75 (previous resistance), then $0.60. The nearest Resistance Zone is $1.00.

Penafian
Maklumat dan penerbitan adalah tidak bertujuan, dan tidak membentuk, nasihat atau cadangan kewangan, pelaburan, dagangan atau jenis lain yang diberikan atau disahkan oleh TradingView. Baca lebih dalam Terma Penggunaan.
Penafian
Maklumat dan penerbitan adalah tidak bertujuan, dan tidak membentuk, nasihat atau cadangan kewangan, pelaburan, dagangan atau jenis lain yang diberikan atau disahkan oleh TradingView. Baca lebih dalam Terma Penggunaan.