
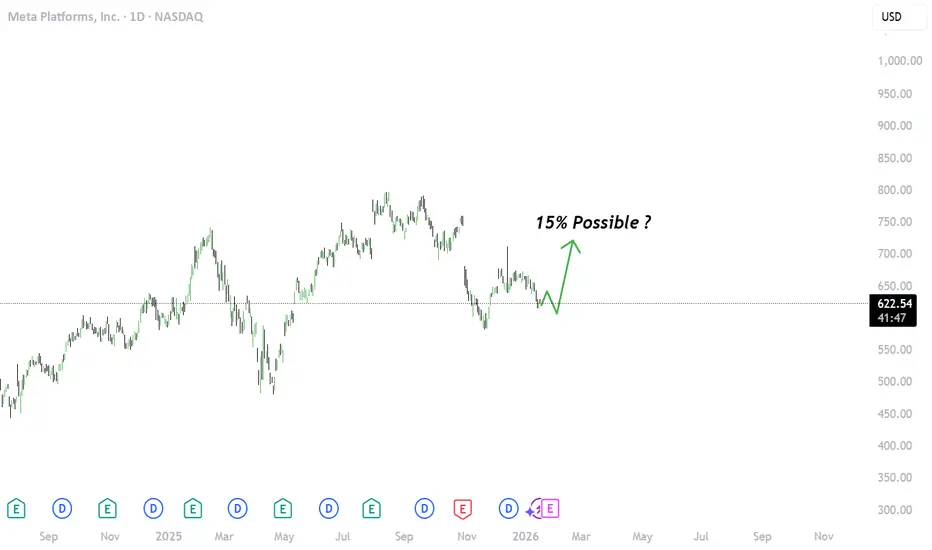
Why Meta Stock Has Dropped from Prior Highs
Heavy AI and Infrastructure Spending
Meta is spending massive amounts on AI infrastructure and data centers (increased CAPEX) tens of billions per year, which increases expenses and spooks investors worried about returns on that capital. This spending has been compared unfavorably to past initiatives like the metaverse.
Earnings Disappointments (Tax and Charge Items)
Meta reported huge one-time charges (like a $16 B tax hit), pushing EPS much lower than expected. Even though revenue was strong, investors focus on earnings per share misses, which can cause steep sell-offs.
CapEx Outlook and Rising Expenses
Future budgets include significantly higher expenses for 2026 and beyond, especially compensation for AI talent and infrastructure, which reduces near-term profitability expectations.
Profit Volatility Relative to Expectations
Meta’s third-quarter results showed revenue growth but lower than anticipated profits, a classic catalyst for price declines in high-growth stocks.
Macro & Sector Rotation
Tech stocks overall have seen periods of rotation into other sectors. Aggressive spending without clear near-term ROI tends to amplify volatility in growth tech. Bottom line: Meta’s decline isn’t usually due to revenue collapse, it’s tied to higher costs, big tax impacts, investor expectations around AI ROI, and macro tech sentiment.
Key Financial Metrics (Fundamentals)
Here’s how Meta looks from a fundamentals perspective:
-Current price: ~$620+ (still below historical highs)
-Market cap: ~$1.8 T
-Profit margin: ~30.9%, strong tech profitability level
-Return on Equity (ROE): ~32–33%, very high for large cap tech
-Return on Assets (ROA): ~18%, excellent efficiency
-Revenue (TTM): ~$189 B
-Net Income (TTM): ~$58.5 B
-Free Cash Flow: ~$44.8 B
-Cash on hand: Over $40 B
-Debt/Eq: relatively low (~0.15–0.26 depending on source)
-P/E: ~31–32 times earnings, moderate for FAANG/Magnificent Seven stocks
Takeaway: Meta is financially very strong, generating large profits, cash flow, and solid returns on capital, with low debt relative to equity.
Bullish Case :
Huge cash flow and profitability
Meta generates tens of billions in free cash flow annually, strong cushion for investments and shareholder returns.
Advertising dominance
Its core platforms (Facebook, Instagram, WhatsApp) still monetize very effectively, driving revenue growth.
Strong balance sheet and low leverage
High cash, low debt → less financial risk relative to spending.
AI monetization potential
Meta’s AI tools (e.g., Advantage+ ads) are broadening engagement and could drive future top-line growth, differentiating it from rivals.
Analyst price targets and sentiment
Many analysts still rate Meta as a Strong Buy with targets above current levels (e.g., ~$825 consensus).
Part of tech “Magnificent Seven”
Peer group includes top AI/tech innovators, which can help re-rating if tech sentiment improves.
Cons Case :
Very heavy capital expenditure
Billions in annual spending on AI hardware and data centers without clear near-term revenue payoff makes some investors nervous.
Profit swings due to tax/one-offs
Big unexpected charges (like the ~$16 B tax hit) hurt EPS and can distort investor perceptions.
Short-term earnings pressure
Despite revenue growth, growing expenses can compress margins and temporarily lower profit growth estimates.
Valuation still not cheap
P/E in low-30s isn’t “deep value”, investors expect growth acceleration to justify it.
Competitive threats
TikTok and other AI-driven platforms continue to eat engagement/time, creating pressure on ad growth.
Market volatility and tech sentiment risk
Broader macro and tech sector shifts can weigh on share price even if Meta fundamentals are good.
Disclaimer:
This analysis is for informational and educational purposes only and does not constitute financial advice, investment recommendation, or an offer to buy or sell any securities. Asset prices, valuations, and performance metrics are subject to change and may be outdated. Always conduct your own due diligence and consult with a licensed financial advisor before making investment decisions. The information presented may contain inaccuracies and should not be solely relied upon for financial decisions. I am not a licensed financial advisor or professional trader. I am not personally liable for your own losses; this is not financial advice.

Penafian
Maklumat dan penerbitan adalah tidak bertujuan, dan tidak membentuk, nasihat atau cadangan kewangan, pelaburan, dagangan atau jenis lain yang diberikan atau disahkan oleh TradingView. Baca lebih dalam Terma Penggunaan.
Penafian
Maklumat dan penerbitan adalah tidak bertujuan, dan tidak membentuk, nasihat atau cadangan kewangan, pelaburan, dagangan atau jenis lain yang diberikan atau disahkan oleh TradingView. Baca lebih dalam Terma Penggunaan.