
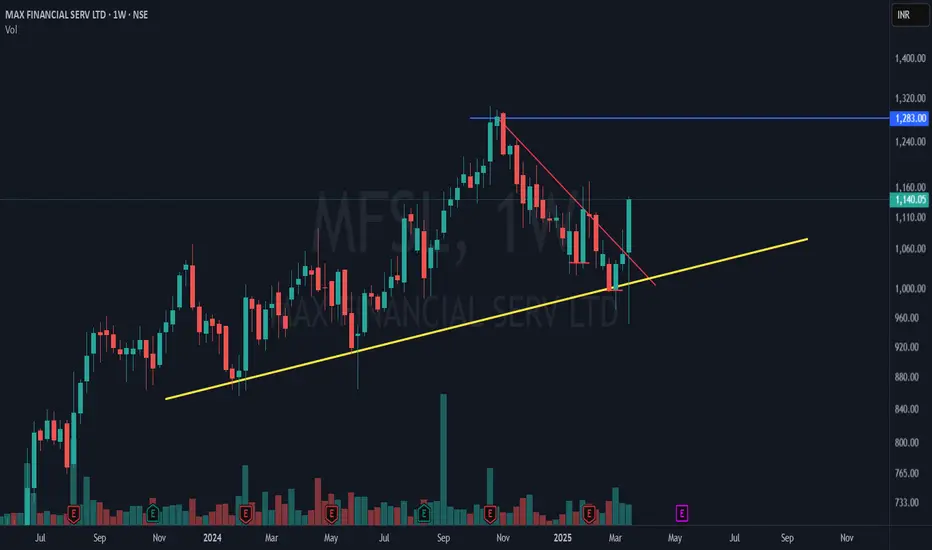
🚀 Technical Analysis Breakdown:
The yellow trendline shows a long-term support, which has held well despite recent corrections.
The red downtrend line indicates a recent bearish phase, which has now been broken with a strong bullish candle.
The stock has bounced from the trendline support, showing signs of strength.
Above all the strong Pinbar candle looks amazing for a candle close .
🔎 Your Take? Do you see further upside or a pullback? Comment below! 👇
The yellow trendline shows a long-term support, which has held well despite recent corrections.
The red downtrend line indicates a recent bearish phase, which has now been broken with a strong bullish candle.
The stock has bounced from the trendline support, showing signs of strength.
Above all the strong Pinbar candle looks amazing for a candle close .
🔎 Your Take? Do you see further upside or a pullback? Comment below! 👇

📊Swing & positional research with Buy, Sell & Hold recommendations
Contact for NOVEMBER SLOTS
📞WhatsApp ( Pro ): wa.me/919455664601
📢Free Picks on Telegram ( Join ) : t.me/hashtaghammer
Apoorv Dubey|SEBI RA INH000030287
Contact for NOVEMBER SLOTS
📞WhatsApp ( Pro ): wa.me/919455664601
📢Free Picks on Telegram ( Join ) : t.me/hashtaghammer
Apoorv Dubey|SEBI RA INH000030287
Penerbitan berkaitan
Penafian
Maklumat dan penerbitan adalah tidak bertujuan, dan tidak membentuk, nasihat atau cadangan kewangan, pelaburan, dagangan atau jenis lain yang diberikan atau disahkan oleh TradingView. Baca lebih dalam Terma Penggunaan.
📊Swing & positional research with Buy, Sell & Hold recommendations
Contact for NOVEMBER SLOTS
📞WhatsApp ( Pro ): wa.me/919455664601
📢Free Picks on Telegram ( Join ) : t.me/hashtaghammer
Apoorv Dubey|SEBI RA INH000030287
Contact for NOVEMBER SLOTS
📞WhatsApp ( Pro ): wa.me/919455664601
📢Free Picks on Telegram ( Join ) : t.me/hashtaghammer
Apoorv Dubey|SEBI RA INH000030287
Penerbitan berkaitan
Penafian
Maklumat dan penerbitan adalah tidak bertujuan, dan tidak membentuk, nasihat atau cadangan kewangan, pelaburan, dagangan atau jenis lain yang diberikan atau disahkan oleh TradingView. Baca lebih dalam Terma Penggunaan.