
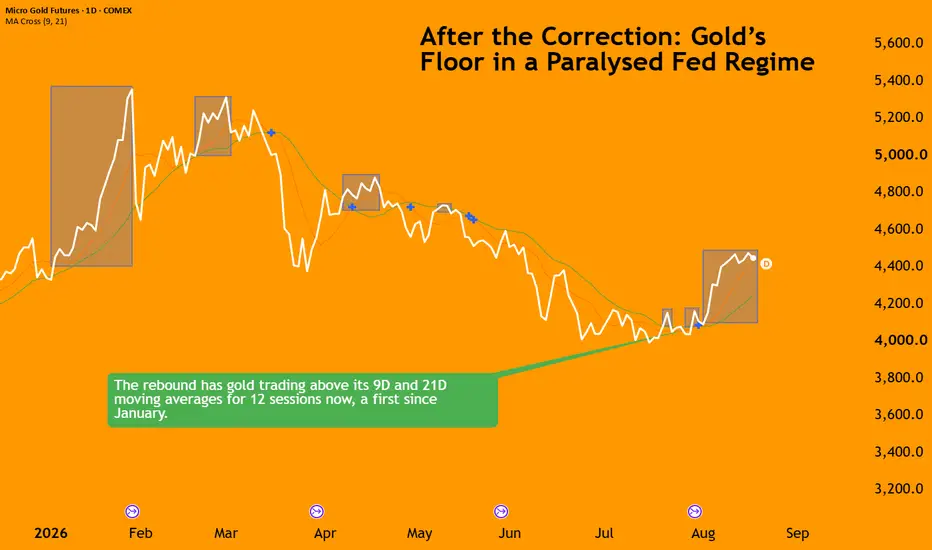
Gold is still well below its January peak, but the correction has started to stabilise. Currently, COMEX futures are trading near $4,385, roughly 22% below the $5,602 high.
The immediate trigger comes from a change in the rate outlook.
July payrolls fell by 23,000, with May and June revised down by a combined 103,000. Then July CPI came in softer, with core inflation slowing to 2.5% year on year. A September hike had been a live risk earlier in the summer, but it is now much harder for the Fed to justify.

However, the rate repricing only explains the bounce. It does not explain why the selling stopped around $4,000, how much of the recovery is being driven by fresh speculative length, or whether gold can keep moving higher while real yields remain elevated. Those questions sit at the centre of the current setup.
Who Bought the Dip
The World Gold Council’s Q2 numbers establish that the correction found real support, even if the picture was not uniformly strong across every buyer group. Total demand, including OTC activity, held at 1,269 tonnes in the quarter. That took first-half demand to 2,522 tonnes, up 2% year on year and worth a record $380 billion.
Central banks were the clearest source of strength, with official-sector purchases reaching 289 tonnes, the highest second-quarter total on record. Poland was the largest reported buyer, but China also stepped up by adding 33 tonnes. The caveat is that Q1 official demand was weak after revisions, leaving first-half central-bank buying at 345 tonnes, the lowest H1 total since 2022.

Source: Gold.org
Jewellery demand weakened as high prices constrained affordability. Global consumption fell to 278 tonnes, its lowest level since the pandemic. But that did not translate into a collapse in spending: jewellery outlays still rose 14% YoY to $40 billion, as buyers shifted toward lighter pieces, lower-carat products and old-for-new exchanges.

Source: Gold.org
ETF flows told a more regional story, with global physically backed funds losing 45 tonnes in Q2, or about $4 billion, all on account of just North American funds. Asian funds were also down 15 tonnes, but they remained up 70 tonnes over the first half, making it the region’s strongest H1 on record.

Source: Gold.org
The PBOC, in fact, made its largest monthly addition since October 2023, adding roughly 20 tonnes in July, bringing holdings to over 76 million ounces.
The Tape Since the High
Gold ran aggressively into January, and by early July, spot briefly pierced $4,000 to print in the high $3,900s. Sure, some of the January move had been speculative, but the market was also reassessing the policy implications of a Warsh-led Fed.
The rebound since then has also brought speculators back. Managed money has moved back into the rally with stronger open interest week-on-week, all while longs rose faster than shorts. This points to fresh speculative demand rather than a rebound driven purely by short covering.

Source: CME QuikStrike
Smaller and retail traders also turned more constructive into the rebound. Net length rose to its highest level in the period shown, led by a renewed increase in outright longs rather than a reduction in shorts.

Source: CME QuikStrike
The macro picture is mixed rather than uniformly supportive. The dollar has eased as markets have priced out some of the September-hike risk, with DXY falling from above 101 in late July to around 99.5.
Real yields are the less accommodating part of the picture. The 10-year Treasury yield remains near 4.64%, while 10-year TIPS yields touched 2.42% in late July and remain close to 2.4%. Those are levels that would normally limit gold’s upside by raising the opportunity cost of holding bullion.

In a nutshell, the current move rests more on the conviction that the Fed may not be able to deliver another hike. Whether that is enough to sustain the rebound will depend on whether the labour data continue to close that door.
The Box the Fed Is In
On July 29, the FOMC voted 9–3 to maintain the federal funds target range at 3.50–3.75%—the sixth consecutive hold and an unchanged rate since December.
Chair Warsh reiterated a strict 2% inflation target, stating there is no soft alternative, yet no action was taken. That assessment was written before the July jobs report.
Payrolls then fell by 23,000, while May and June were revised down by a combined 103,000. The three-month payroll average is now only 20,000, and participation has fallen to 61.4%, down 0.7 percentage points since January.
July headline CPI rose only 0.1% month on month, but energy remains 14.7% higher than a year ago, even after falling 1.5% in July alone. The monthly decline there is owing to lower gasoline prices; the year-on-year energy problem has not disappeared.
The Hormuz situation also keeps that risk alive, with the Strait’s closure certain until Iran deems its conditions met and Brent anchored in the high $80s. The Fed cannot directly fix an oil-supply shock, but it also cannot dismiss the possibility that higher energy prices bleed back into headline inflation and expectations.

Source: CME
CME FedWatch now assigns roughly a two-thirds probability to rates remaining at 3.50%–3.75%, versus roughly one-third for a 25-basis-point hike.
Gold thrives within this exact box: a rate hike into a negative 23,000 payroll print is unviable, while the Hormuz blockade prevents clean disinflation.
Historical Parallel: October 2023 to March 2024
In early October 2023, gold traded down to $1,810 just as 10-year real yields hit cycle highs. The Fed had delivered its final hike in July (to 5.25–5.50%) and continued signalling higher-for-longer. No easing was on the horizon.
When geopolitical conflict escalated in early October, the marginal threat of further rate hikes faded, and gold surged.

By late March 2024, spot broke through $2,230, even though the first actual rate cut did not materialise until September 2024.
For this historical-hypothetical scenario played in real-time, a realistic entry window sits around mid-October, after the market had started to reject the breakdown. A trader using the April 2024 Micro Gold contract, for example, could have entered at $1,950, once the reversal was established.
After rallies in the final quarter of 2023, gold consolidated and trended around $2050 for a few months. The breakout came in March, and by early April, the contract was trading near $2,330.

Exiting during the first week of April would have captured the main move while avoiding the temptation to hold a maturing contract into its final weeks.
Contract size: 1 Micro Gold futures contract, representing 10 troy ounces.
Entry: $1,950/oz
Exit: $2,310/oz
Total P&L: $360 x 10 oz = $3600
One Micro Gold contract represents 10 troy ounces, so every $1 move in gold changes the contract value by $10.
What the market rewarded then was not policy accommodation, but the removal of the next tightening increment, all against an active geopolitical backdrop and persistent physical demand.
Today's setup follows the same structure:
If this analogy holds, the trade does not depend on Warsh delivering a dovish surprise at Jackson Hole as well. Hawkish momentum has already crested in the macroeconomic data, allowing gold to work higher while the Fed Chair continues to defend the 2% inflation target.
This content is sponsored.
MARKET DATA
CME Real-time Market Data helps identify trading setups and more effectively express market views. If you have futures in your trading portfolio, you can check out on CME Group data plans available that suit your trading needs at tradingview.com/cme.
DISCLAIMER
This case study is for educational purposes only and does not constitute investment recommendations or advice. Nor are they used to promote any specific products, or services.
Trading or investment ideas cited here are for illustration only, as an integral part of a case study to demonstrate the fundamental concepts in risk management or trading under the market scenarios being discussed.
The immediate trigger comes from a change in the rate outlook.
July payrolls fell by 23,000, with May and June revised down by a combined 103,000. Then July CPI came in softer, with core inflation slowing to 2.5% year on year. A September hike had been a live risk earlier in the summer, but it is now much harder for the Fed to justify.
However, the rate repricing only explains the bounce. It does not explain why the selling stopped around $4,000, how much of the recovery is being driven by fresh speculative length, or whether gold can keep moving higher while real yields remain elevated. Those questions sit at the centre of the current setup.
Who Bought the Dip
The World Gold Council’s Q2 numbers establish that the correction found real support, even if the picture was not uniformly strong across every buyer group. Total demand, including OTC activity, held at 1,269 tonnes in the quarter. That took first-half demand to 2,522 tonnes, up 2% year on year and worth a record $380 billion.
Central banks were the clearest source of strength, with official-sector purchases reaching 289 tonnes, the highest second-quarter total on record. Poland was the largest reported buyer, but China also stepped up by adding 33 tonnes. The caveat is that Q1 official demand was weak after revisions, leaving first-half central-bank buying at 345 tonnes, the lowest H1 total since 2022.
Source: Gold.org
Jewellery demand weakened as high prices constrained affordability. Global consumption fell to 278 tonnes, its lowest level since the pandemic. But that did not translate into a collapse in spending: jewellery outlays still rose 14% YoY to $40 billion, as buyers shifted toward lighter pieces, lower-carat products and old-for-new exchanges.
Source: Gold.org
ETF flows told a more regional story, with global physically backed funds losing 45 tonnes in Q2, or about $4 billion, all on account of just North American funds. Asian funds were also down 15 tonnes, but they remained up 70 tonnes over the first half, making it the region’s strongest H1 on record.
Source: Gold.org
The PBOC, in fact, made its largest monthly addition since October 2023, adding roughly 20 tonnes in July, bringing holdings to over 76 million ounces.
The Tape Since the High
Gold ran aggressively into January, and by early July, spot briefly pierced $4,000 to print in the high $3,900s. Sure, some of the January move had been speculative, but the market was also reassessing the policy implications of a Warsh-led Fed.
The rebound since then has also brought speculators back. Managed money has moved back into the rally with stronger open interest week-on-week, all while longs rose faster than shorts. This points to fresh speculative demand rather than a rebound driven purely by short covering.
Source: CME QuikStrike
Smaller and retail traders also turned more constructive into the rebound. Net length rose to its highest level in the period shown, led by a renewed increase in outright longs rather than a reduction in shorts.
Source: CME QuikStrike
The macro picture is mixed rather than uniformly supportive. The dollar has eased as markets have priced out some of the September-hike risk, with DXY falling from above 101 in late July to around 99.5.
Real yields are the less accommodating part of the picture. The 10-year Treasury yield remains near 4.64%, while 10-year TIPS yields touched 2.42% in late July and remain close to 2.4%. Those are levels that would normally limit gold’s upside by raising the opportunity cost of holding bullion.
In a nutshell, the current move rests more on the conviction that the Fed may not be able to deliver another hike. Whether that is enough to sustain the rebound will depend on whether the labour data continue to close that door.
The Box the Fed Is In
On July 29, the FOMC voted 9–3 to maintain the federal funds target range at 3.50–3.75%—the sixth consecutive hold and an unchanged rate since December.
Chair Warsh reiterated a strict 2% inflation target, stating there is no soft alternative, yet no action was taken. That assessment was written before the July jobs report.
Payrolls then fell by 23,000, while May and June were revised down by a combined 103,000. The three-month payroll average is now only 20,000, and participation has fallen to 61.4%, down 0.7 percentage points since January.
July headline CPI rose only 0.1% month on month, but energy remains 14.7% higher than a year ago, even after falling 1.5% in July alone. The monthly decline there is owing to lower gasoline prices; the year-on-year energy problem has not disappeared.
The Hormuz situation also keeps that risk alive, with the Strait’s closure certain until Iran deems its conditions met and Brent anchored in the high $80s. The Fed cannot directly fix an oil-supply shock, but it also cannot dismiss the possibility that higher energy prices bleed back into headline inflation and expectations.
Source: CME
CME FedWatch now assigns roughly a two-thirds probability to rates remaining at 3.50%–3.75%, versus roughly one-third for a 25-basis-point hike.
Gold thrives within this exact box: a rate hike into a negative 23,000 payroll print is unviable, while the Hormuz blockade prevents clean disinflation.
Historical Parallel: October 2023 to March 2024
In early October 2023, gold traded down to $1,810 just as 10-year real yields hit cycle highs. The Fed had delivered its final hike in July (to 5.25–5.50%) and continued signalling higher-for-longer. No easing was on the horizon.
When geopolitical conflict escalated in early October, the marginal threat of further rate hikes faded, and gold surged.
By late March 2024, spot broke through $2,230, even though the first actual rate cut did not materialise until September 2024.
For this historical-hypothetical scenario played in real-time, a realistic entry window sits around mid-October, after the market had started to reject the breakdown. A trader using the April 2024 Micro Gold contract, for example, could have entered at $1,950, once the reversal was established.
After rallies in the final quarter of 2023, gold consolidated and trended around $2050 for a few months. The breakout came in March, and by early April, the contract was trading near $2,330.
Exiting during the first week of April would have captured the main move while avoiding the temptation to hold a maturing contract into its final weeks.
Contract size: 1 Micro Gold futures contract, representing 10 troy ounces.
Entry: $1,950/oz
Exit: $2,310/oz
Total P&L: $360 x 10 oz = $3600
One Micro Gold contract represents 10 troy ounces, so every $1 move in gold changes the contract value by $10.
What the market rewarded then was not policy accommodation, but the removal of the next tightening increment, all against an active geopolitical backdrop and persistent physical demand.
Today's setup follows the same structure:
- Labour Weakness: The employment picture is weaker today than in late 2023, making additional rate hikes even more difficult to justify.
- Structural Base: Gold is currently digesting a 22% post-peak correction rather than grinding out of a mid-cycle consolidation at $1,800. However, sovereign central-bank accumulation underneath $4,000 is substantially larger than it was during the previous cycle.
If this analogy holds, the trade does not depend on Warsh delivering a dovish surprise at Jackson Hole as well. Hawkish momentum has already crested in the macroeconomic data, allowing gold to work higher while the Fed Chair continues to defend the 2% inflation target.
This content is sponsored.
MARKET DATA
CME Real-time Market Data helps identify trading setups and more effectively express market views. If you have futures in your trading portfolio, you can check out on CME Group data plans available that suit your trading needs at tradingview.com/cme.
DISCLAIMER
This case study is for educational purposes only and does not constitute investment recommendations or advice. Nor are they used to promote any specific products, or services.
Trading or investment ideas cited here are for illustration only, as an integral part of a case study to demonstrate the fundamental concepts in risk management or trading under the market scenarios being discussed.

Full Disclaimer - linktr.ee/mintfinance
Penafian
Maklumat dan penerbitan adalah tidak bertujuan, dan tidak membentuk, nasihat atau cadangan kewangan, pelaburan, dagangan atau jenis lain yang diberikan atau disahkan oleh TradingView. Baca lebih dalam Terma Penggunaan.
Full Disclaimer - linktr.ee/mintfinance
Penafian
Maklumat dan penerbitan adalah tidak bertujuan, dan tidak membentuk, nasihat atau cadangan kewangan, pelaburan, dagangan atau jenis lain yang diberikan atau disahkan oleh TradingView. Baca lebih dalam Terma Penggunaan.