
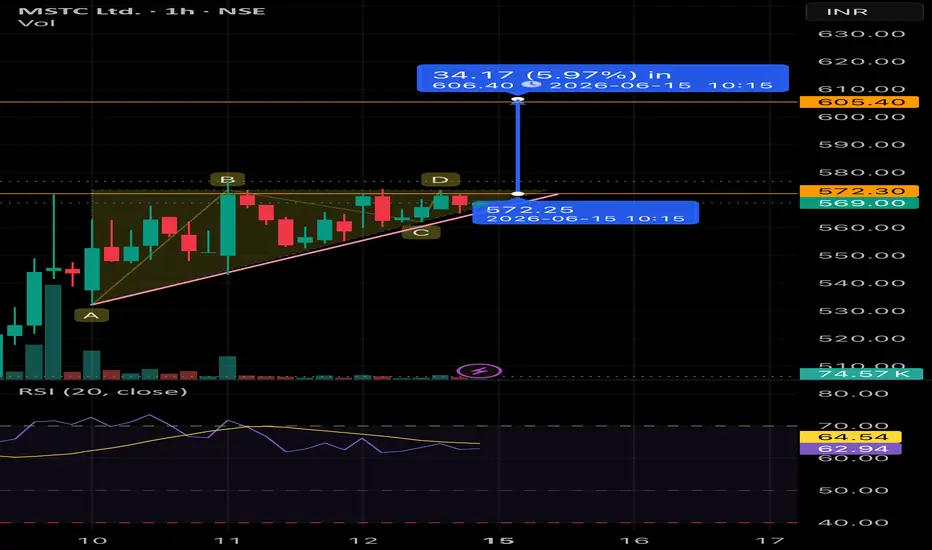
MSTC Ltd. (1H Chart) – Ascending Triangle Watch
MSTC is showing signs of strength on the 1-hour timeframe. Price has been forming higher lows while facing resistance near ₹572-573, creating an ascending triangle structure. The rising trendline support remains intact, indicating buyers are gradually gaining control.
Key Observations
* Multiple attempts to cross ₹572-573 suggest supply is getting absorbed.
* Rising trendline from the recent swing low continues to support the bullish structure.
* RSI is holding above 60, indicating positive momentum, though not yet in an overbought zone.
* A decisive breakout above ₹572.30 can trigger fresh buying interest.
Bullish Scenario
* Sustained move above ₹572.30 may open the path toward:
* ₹585
* ₹595
* ₹605-606 (pattern-measured target)
Support Levels
* Immediate Support: ₹565
* Trendline Support: ₹560
* Strong Support Zone: ₹552-555
Risk Factors
* Failure to hold above ₹565 may result in consolidation within the current range.
* Breakdown below the rising trendline could weaken the bullish setup and shift focus toward lower supports.
MSTC is showing signs of strength on the 1-hour timeframe. Price has been forming higher lows while facing resistance near ₹572-573, creating an ascending triangle structure. The rising trendline support remains intact, indicating buyers are gradually gaining control.
Key Observations
* Multiple attempts to cross ₹572-573 suggest supply is getting absorbed.
* Rising trendline from the recent swing low continues to support the bullish structure.
* RSI is holding above 60, indicating positive momentum, though not yet in an overbought zone.
* A decisive breakout above ₹572.30 can trigger fresh buying interest.
Bullish Scenario
* Sustained move above ₹572.30 may open the path toward:
* ₹585
* ₹595
* ₹605-606 (pattern-measured target)
Support Levels
* Immediate Support: ₹565
* Trendline Support: ₹560
* Strong Support Zone: ₹552-555
Risk Factors
* Failure to hold above ₹565 may result in consolidation within the current range.
* Breakdown below the rising trendline could weaken the bullish setup and shift focus toward lower supports.

Penafian
Maklumat dan penerbitan adalah tidak bertujuan, dan tidak membentuk, nasihat atau cadangan kewangan, pelaburan, dagangan atau jenis lain yang diberikan atau disahkan oleh TradingView. Baca lebih dalam Terma Penggunaan.
Penafian
Maklumat dan penerbitan adalah tidak bertujuan, dan tidak membentuk, nasihat atau cadangan kewangan, pelaburan, dagangan atau jenis lain yang diberikan atau disahkan oleh TradingView. Baca lebih dalam Terma Penggunaan.