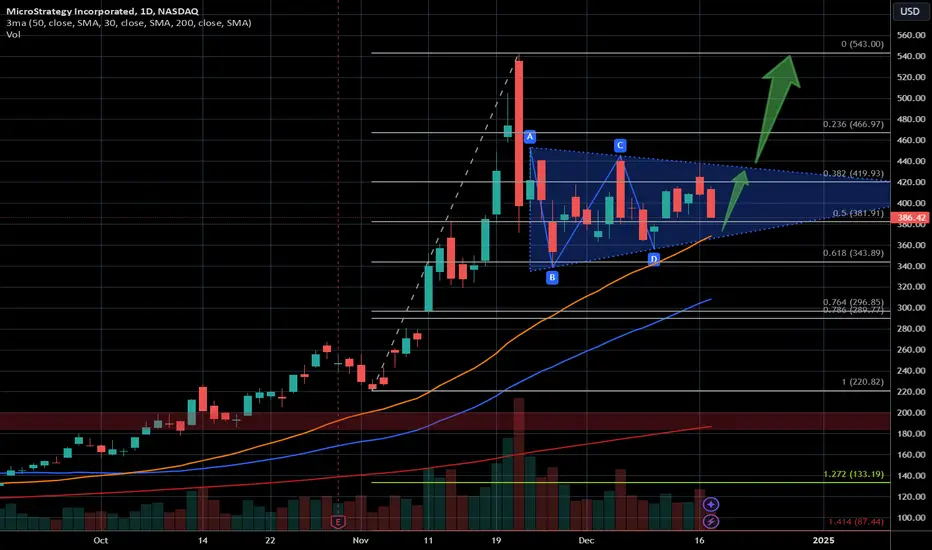
Here is the daily chart for $MSTR. With its recent inclusion in  QQQ, the stock appears poised for further growth.
From a technical perspective, the current triangle formation suggests potential downside movement toward $368, where the price may test the lower boundary of the pattern. Following this, I anticipate a bullish breakout to the upside.
The resistance near the previous all-time high (ATH) is unlikely to hold for long, and I expect MSTR to surpass this level in its upward trajectory.
QQQ, the stock appears poised for further growth.From a technical perspective, the current triangle formation suggests potential downside movement toward $368, where the price may test the lower boundary of the pattern. Following this, I anticipate a bullish breakout to the upside.
The resistance near the previous all-time high (ATH) is unlikely to hold for long, and I expect
MSTR to surpass this level in its upward trajectory.Dagangan aktif
The triangle completely failed (haters put shame on me ;) ), but I'm staying bullish for now. The line chart is offering a bullish flag like this:Let's see if it plays out. Price should stabilize by the 23rd of Dec because all ETFs got to buy by this date. Maybe we see tomorrow already a bullish day. Let's see.

Penafian
Maklumat dan penerbitan adalah tidak bertujuan, dan tidak membentuk, nasihat atau cadangan kewangan, pelaburan, dagangan atau jenis lain yang diberikan atau disahkan oleh TradingView. Baca lebih dalam Terma Penggunaan.
Penafian
Maklumat dan penerbitan adalah tidak bertujuan, dan tidak membentuk, nasihat atau cadangan kewangan, pelaburan, dagangan atau jenis lain yang diberikan atau disahkan oleh TradingView. Baca lebih dalam Terma Penggunaan.