Panjang
MTL reversal
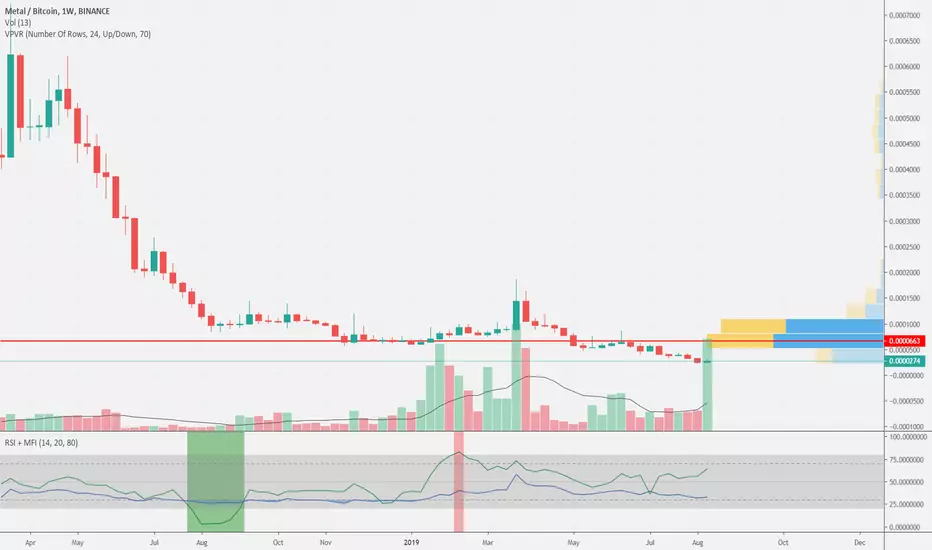
I will not draw anything (just hidden my drawings actually), as I need you to look at the volume and nothing else. This is week chart. The visible volume range bar red line (maximum density) is located around 650. MOre, if you zoom in, at 500-530. These are targets for the pump. Good luck =)
Nota
Seems that Trading View doesn't remember the way I posted it with hidden drawings. Excuse me for that. Now it looks messy and nothing can be seen there. But its there, believe me =)
FREE telegram channels:
Main crypto channel - t.me/WiseAnalyze
Crypto chat - t.me/WiseAnalyzeChat
Crypto watchlist - t.me/wiseanalize
Main crypto channel - t.me/WiseAnalyze
Crypto chat - t.me/WiseAnalyzeChat
Crypto watchlist - t.me/wiseanalize
Penafian
Maklumat dan penerbitan adalah tidak bertujuan, dan tidak membentuk, nasihat atau cadangan kewangan, pelaburan, dagangan atau jenis lain yang diberikan atau disahkan oleh TradingView. Baca lebih dalam Terma Penggunaan.
FREE telegram channels:
Main crypto channel - t.me/WiseAnalyze
Crypto chat - t.me/WiseAnalyzeChat
Crypto watchlist - t.me/wiseanalize
Main crypto channel - t.me/WiseAnalyze
Crypto chat - t.me/WiseAnalyzeChat
Crypto watchlist - t.me/wiseanalize
Penafian
Maklumat dan penerbitan adalah tidak bertujuan, dan tidak membentuk, nasihat atau cadangan kewangan, pelaburan, dagangan atau jenis lain yang diberikan atau disahkan oleh TradingView. Baca lebih dalam Terma Penggunaan.