
1️⃣ Structural Situation
A range formed at the top.
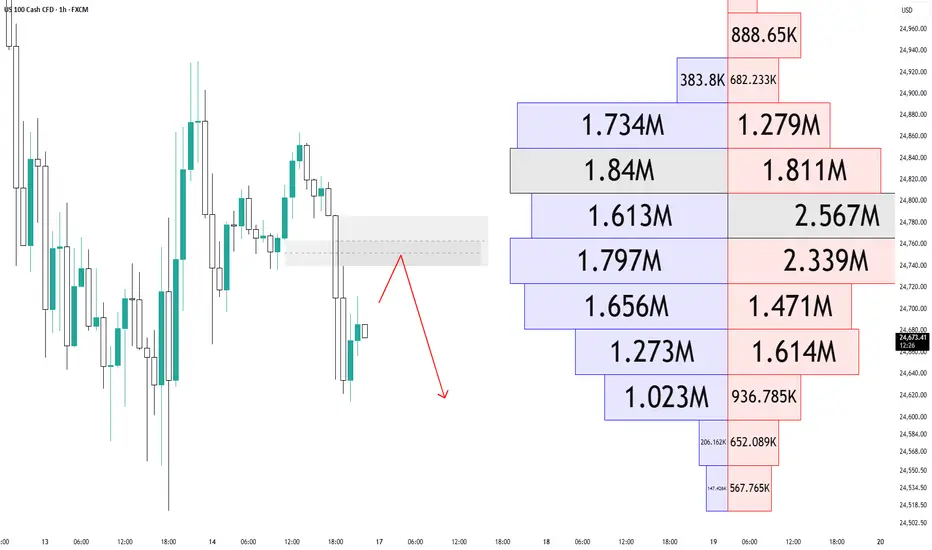
The gray area represents a supply / distribution zone.
A strong downside displacement occurred from that zone.
After the drop, price is showing a weak reaction (possible dead cat bounce).
The primary flow is currently bearish.
2️⃣ Volume Profile Reading
The footprint / volume distribution on the right side is critical:
Heavy volume clusters around 1.613M – 1.797M – 2.339M – 2.567M.
The largest volume node is 2.567M → this signals acceptance.
Upper nodes such as 1.734M and 1.84M may now act as supply.
What this suggests:
Even if price bounces,
volume structure does not support sustained upside.
Seller participation appears more organized.
3️⃣ Higher Probability Scenario
🔴 Most likely scenario:
Pullback into the gray supply zone
Formation of a lower high
Liquidity sweep below the recent low
Continuation toward 24,620 – 24,580
Reasons:
Clear downside displacement
Weak recovery structure
Volume acceptance below
4️⃣ Invalidation Conditions
The bearish scenario weakens if we see:
A strong high-volume close above the gray zone
Clear positive delta expansion
A higher high instead of a lower high
Without those, rallies are likely to be selling opportunities.
A range formed at the top.
The gray area represents a supply / distribution zone.
A strong downside displacement occurred from that zone.
After the drop, price is showing a weak reaction (possible dead cat bounce).
The primary flow is currently bearish.
2️⃣ Volume Profile Reading
The footprint / volume distribution on the right side is critical:
Heavy volume clusters around 1.613M – 1.797M – 2.339M – 2.567M.
The largest volume node is 2.567M → this signals acceptance.
Upper nodes such as 1.734M and 1.84M may now act as supply.
What this suggests:
Even if price bounces,
volume structure does not support sustained upside.
Seller participation appears more organized.
3️⃣ Higher Probability Scenario
🔴 Most likely scenario:
Pullback into the gray supply zone
Formation of a lower high
Liquidity sweep below the recent low
Continuation toward 24,620 – 24,580
Reasons:
Clear downside displacement
Weak recovery structure
Volume acceptance below
4️⃣ Invalidation Conditions
The bearish scenario weakens if we see:
A strong high-volume close above the gray zone
Clear positive delta expansion
A higher high instead of a lower high
Without those, rallies are likely to be selling opportunities.
Dagangan aktif
Dagangan ditutup: sasaran tercapai

Penafian
Maklumat dan penerbitan adalah tidak bertujuan, dan tidak membentuk, nasihat atau cadangan kewangan, pelaburan, dagangan atau jenis lain yang diberikan atau disahkan oleh TradingView. Baca lebih dalam Terma Penggunaan.
Penafian
Maklumat dan penerbitan adalah tidak bertujuan, dan tidak membentuk, nasihat atau cadangan kewangan, pelaburan, dagangan atau jenis lain yang diberikan atau disahkan oleh TradingView. Baca lebih dalam Terma Penggunaan.