
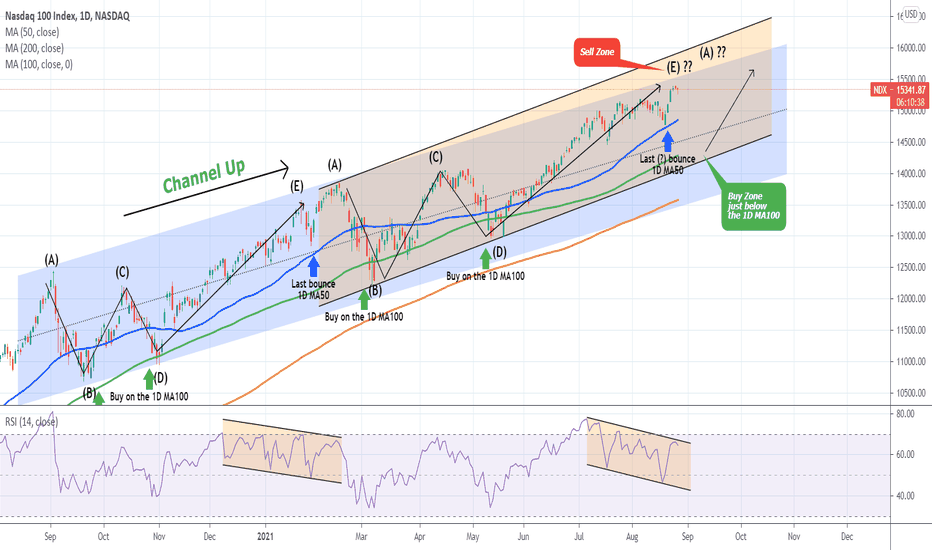
This idea is a continuation to my analysis posted on August 26:
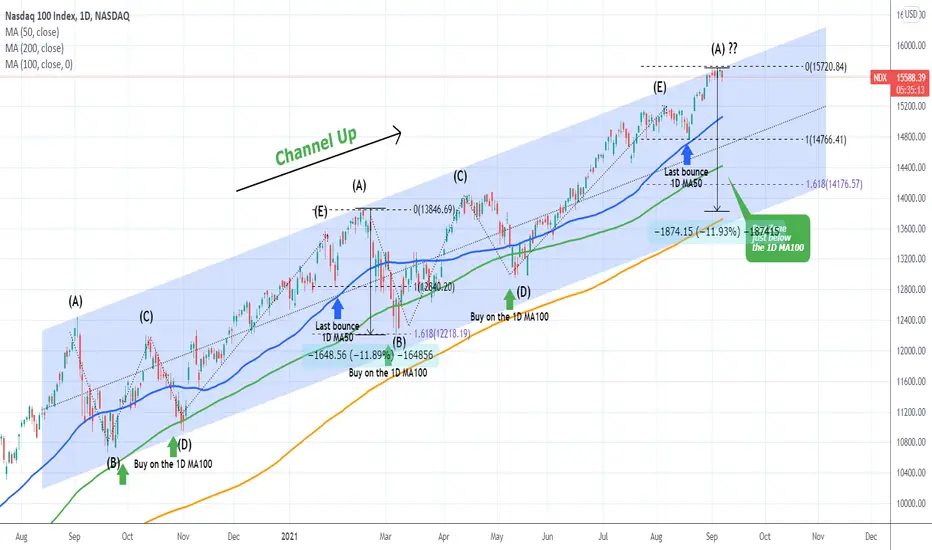
It appears that the leg count and the similarities (so far) of the current price action with the January-February sequence was correct. If the pattern continues to replicate in the same way, then Nasdaq is ahead of a strong correction as this suggests we are currently at the top of the last leg (A).
In February 2021 that resulted in almost a -12% correction that broke below the 1D MA100 (green trend-line) before rebounding. -12% from the top suggests a pull-back value of 13840 while the 1D MA100 is currently at 14417. Perhaps a Fibonacci extension measurement from the last Higher Low (the bounce on the 1D MA50 (blue trend-line)), would be more accurate. In February the correction stopped exactly on the 1.618. Currently the 1.618 Fib ext is at 14176.50.
If this is indeed the start of a similar correction within the long-term Channel Up, is that a reasonable target for you?
** Please support this idea with your likes and comments, it is the best way to keep it relevant and support me. **
--------------------------------------------------------------------------------------------------------
!! Donations via TradingView coins also help me a great deal at posting more free trading content and signals here !!
🎉 👍 Shout-out to TradingShot's 💰 top TradingView Coin donor 💰 this week ==> GJMRealEstate
--------------------------------------------------------------------------------------------------------
It appears that the leg count and the similarities (so far) of the current price action with the January-February sequence was correct. If the pattern continues to replicate in the same way, then Nasdaq is ahead of a strong correction as this suggests we are currently at the top of the last leg (A).
In February 2021 that resulted in almost a -12% correction that broke below the 1D MA100 (green trend-line) before rebounding. -12% from the top suggests a pull-back value of 13840 while the 1D MA100 is currently at 14417. Perhaps a Fibonacci extension measurement from the last Higher Low (the bounce on the 1D MA50 (blue trend-line)), would be more accurate. In February the correction stopped exactly on the 1.618. Currently the 1.618 Fib ext is at 14176.50.
If this is indeed the start of a similar correction within the long-term Channel Up, is that a reasonable target for you?
** Please support this idea with your likes and comments, it is the best way to keep it relevant and support me. **
--------------------------------------------------------------------------------------------------------
!! Donations via TradingView coins also help me a great deal at posting more free trading content and signals here !!
🎉 👍 Shout-out to TradingShot's 💰 top TradingView Coin donor 💰 this week ==> GJMRealEstate
--------------------------------------------------------------------------------------------------------

I trade Crypto, Forex, Indices & Commodities on PrimeXBT — all from one account with TradingView charts 👉 tradingshot.short.gy/PrimeXBT
I also use TradeNation for fixed spreads & zero commission 👉 tradingshot.short.gy/Tradenation
I also use TradeNation for fixed spreads & zero commission 👉 tradingshot.short.gy/Tradenation
Penafian
Maklumat dan penerbitan adalah tidak bertujuan, dan tidak membentuk, nasihat atau cadangan kewangan, pelaburan, dagangan atau jenis lain yang diberikan atau disahkan oleh TradingView. Baca lebih dalam Terma Penggunaan.
I trade Crypto, Forex, Indices & Commodities on PrimeXBT — all from one account with TradingView charts 👉 tradingshot.short.gy/PrimeXBT
I also use TradeNation for fixed spreads & zero commission 👉 tradingshot.short.gy/Tradenation
I also use TradeNation for fixed spreads & zero commission 👉 tradingshot.short.gy/Tradenation
Penafian
Maklumat dan penerbitan adalah tidak bertujuan, dan tidak membentuk, nasihat atau cadangan kewangan, pelaburan, dagangan atau jenis lain yang diberikan atau disahkan oleh TradingView. Baca lebih dalam Terma Penggunaan.