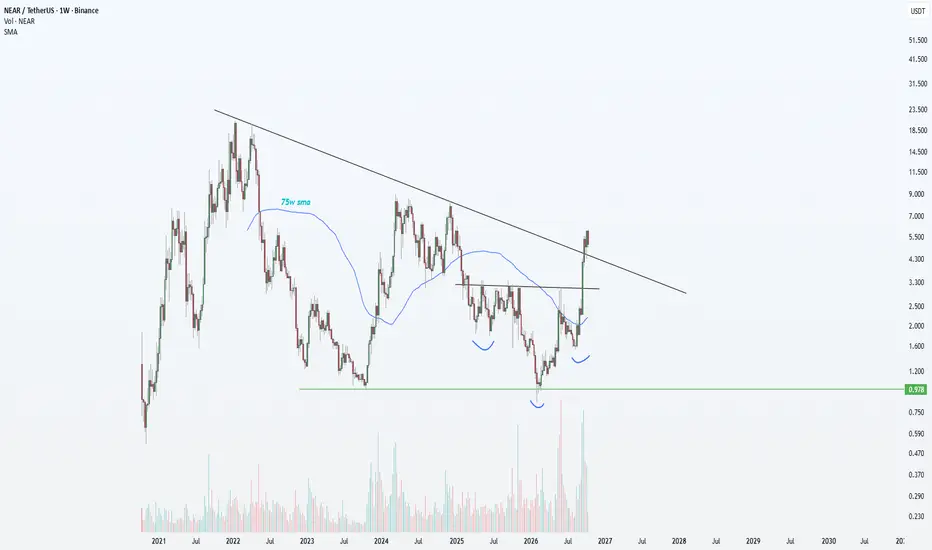
 NEAR has spent almost four years trading beneath the same long term descending resistance. During that period, the $1 area repeatedly acted as the macro floor. The 2026 test of this region produced a strong reaction, followed by a recovery above the 75 week moving average and an aggressive attempt to reclaim the 3usd area
The first breakout attempt was rejected but that does not damage the larger setup yet. What matters now is whether NEAR can hold the 75 week average and build a higher low above the 2026 base. If that happens, pressure against the descending trendline should continue to increase.
real structural change begins with a sustained break above the 3$ region and the multi year resistance line. That would end the sequence of lower macro highs that has controlled NEAR since 2022 and reopen the higher valuation zones around 4.5 to 6, with the old 8$ area becoming relevant later.

Crypto Cycles | Fractals | Onchain | Macro | Market Psychology
Charts here. Daily cycle research on x.com/Cryptollica
Charts here. Daily cycle research on x.com/Cryptollica
Penafian
Maklumat dan penerbitan adalah tidak bertujuan, dan tidak membentuk, nasihat atau cadangan kewangan, pelaburan, dagangan atau jenis lain yang diberikan atau disahkan oleh TradingView. Baca lebih dalam Terma Penggunaan.
Crypto Cycles | Fractals | Onchain | Macro | Market Psychology
Charts here. Daily cycle research on x.com/Cryptollica
Charts here. Daily cycle research on x.com/Cryptollica
Penafian
Maklumat dan penerbitan adalah tidak bertujuan, dan tidak membentuk, nasihat atau cadangan kewangan, pelaburan, dagangan atau jenis lain yang diberikan atau disahkan oleh TradingView. Baca lebih dalam Terma Penggunaan.