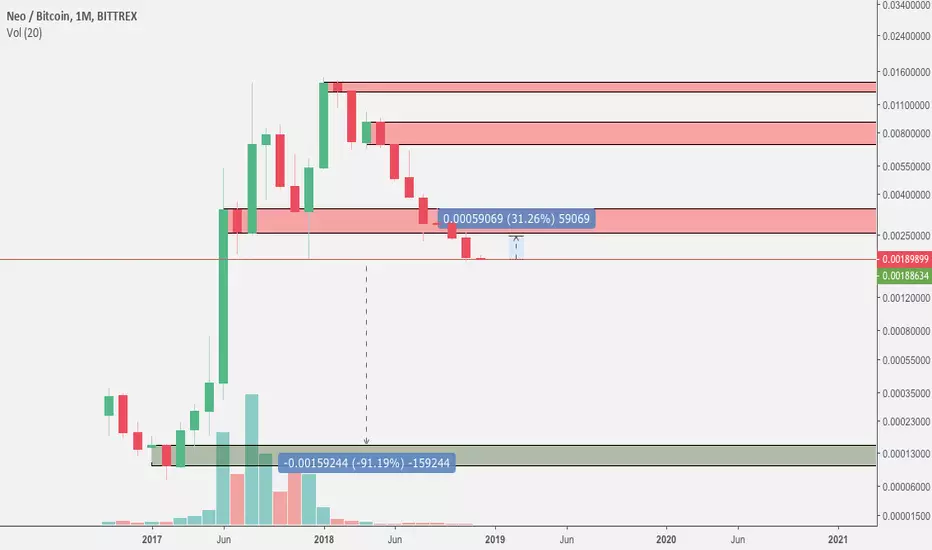
The monthly chart of neobtc looks pretty dangerous, if you're bullish on the NEO project.
Risk averse traders better stay out of NEO at the moment. If you look at weekly/daily levels, you'll see NEO is hanging on the cliff of at least 90% more downwards movements.
However, risk-loving traders might see this as an opportunity. A recovery of NEO might lead to a bounce of 30%. With a tight stop-loss, there are possibilities..
Risk averse traders better stay out of NEO at the moment. If you look at weekly/daily levels, you'll see NEO is hanging on the cliff of at least 90% more downwards movements.
However, risk-loving traders might see this as an opportunity. A recovery of NEO might lead to a bounce of 30%. With a tight stop-loss, there are possibilities..
Pesanan dibatalkan
MISSED A SUPPORT LEVEL. NEW CHART POSTED.
Penafian
Maklumat dan penerbitan adalah tidak bertujuan, dan tidak membentuk, nasihat atau cadangan kewangan, pelaburan, dagangan atau jenis lain yang diberikan atau disahkan oleh TradingView. Baca lebih dalam Terma Penggunaan.
Penafian
Maklumat dan penerbitan adalah tidak bertujuan, dan tidak membentuk, nasihat atau cadangan kewangan, pelaburan, dagangan atau jenis lain yang diberikan atau disahkan oleh TradingView. Baca lebih dalam Terma Penggunaan.