
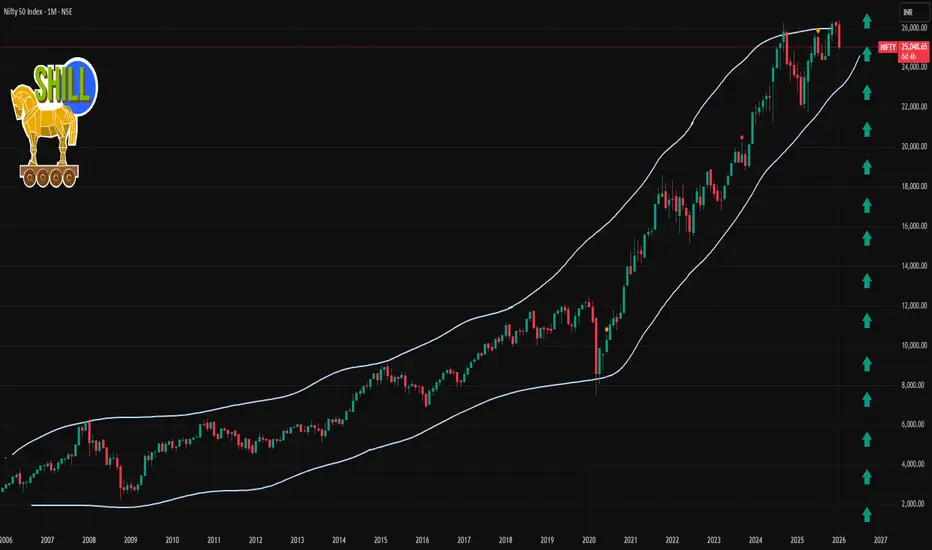
📊 Live Price & Performance (1 Month)
Nifty 50 Index: 25,048.65 (close on 23 Jan 2026)
• Declined ~‑4.3% over the past month.
• 1‑month high ~26,373 / low ~24,919.
📈 Key 1‑Month Technical Levels
🎯 Resistance (Upside)
1. 26,000 – 26,100 — Immediate resistance zone where supply likely increases and prior range top is placed.
2. ~26,300 — 1‑month swing high / recent high area.
Breaking above 26,100–26,300 with momentum would signal a stronger upside breakout.
🛡️ Support (Downside)
1. 25,600 – 25,700 — Key short‑term support cluster (holds medium‑term bullish bias if above this).
2. ~25,000 — Psychological and technical support level (also near recent lows).
3. 24,900 – 24,800 — Lower demand zone from recent 1‑month range.
A breakdown below 25,000 could accelerate downside, while holding above 25,600‑25,700 keeps bulls in control.
📌 What to Watch Next
Bullish breakout trigger: Close above 26,100–26,300.
Bearish catalyst: Sustained move below 25,000.
Neutral/sideways trade: Oscillation between 25,000 and 26,100.

Contact Knowledgehub for a detailed consultation: Dm on WhatsApp: [wa.link/a2o0kz]-
Phone No: [+91 93102 26243]-
Email: [tradingviewknowledgehub@gmail.com]---
-- Let’s achieve success together!
Phone No: [+91 93102 26243]-
Email: [tradingviewknowledgehub@gmail.com]---
-- Let’s achieve success together!
Penerbitan berkaitan
Penafian
Maklumat dan penerbitan adalah tidak bertujuan, dan tidak membentuk, nasihat atau cadangan kewangan, pelaburan, dagangan atau jenis lain yang diberikan atau disahkan oleh TradingView. Baca lebih dalam Terma Penggunaan.