This Analysis is not a trade recommendation, this study is purely for education purpose only, Do your own Study and Research before getting into any trades.
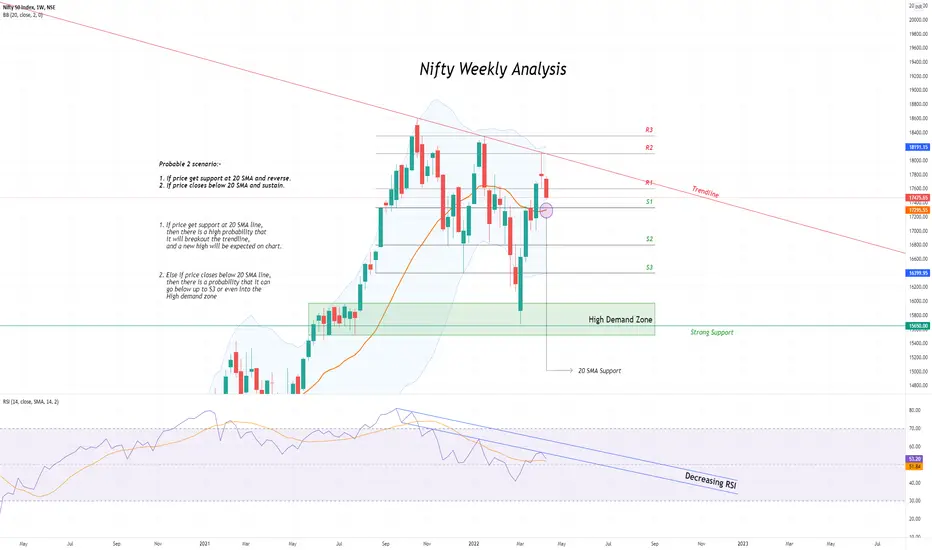
 NIFTY Weekly Analysis.
Currently Nifty is showing weakness on chart:-
1. Did not touch the upper Bollinger Band.
2. Continuously decreasing RSI.
If it fails to get support at the 20 SMA line, then there is a chance that nifty may touch the lower Bollinger Band at S3
NIFTY Weekly Analysis.Currently Nifty is showing weakness on chart:-
1. Did not touch the upper Bollinger Band.
2. Continuously decreasing RSI.
If it fails to get support at the 20 SMA line, then there is a chance that nifty may touch the lower Bollinger Band at S3

Penafian
Maklumat dan penerbitan adalah tidak bertujuan, dan tidak membentuk, nasihat atau cadangan kewangan, pelaburan, dagangan atau jenis lain yang diberikan atau disahkan oleh TradingView. Baca lebih dalam Terma Penggunaan.
Penafian
Maklumat dan penerbitan adalah tidak bertujuan, dan tidak membentuk, nasihat atau cadangan kewangan, pelaburan, dagangan atau jenis lain yang diberikan atau disahkan oleh TradingView. Baca lebih dalam Terma Penggunaan.