
Overview
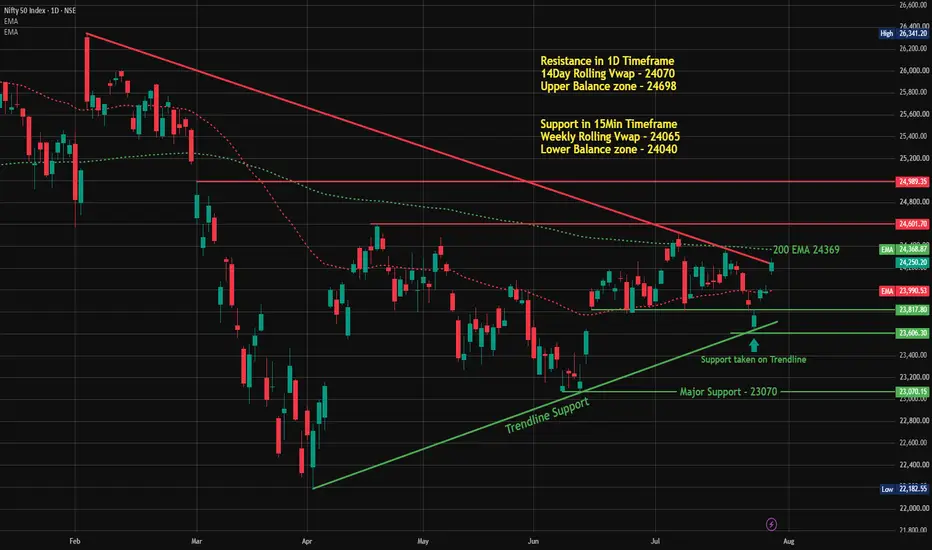
NIFTY respected the rising trendline highlighted in the previous analysis and delivered a strong recovery, confirming that buyers continue to defend the higher-low structure. The rally has successfully reclaimed the 50 EMA and moved back above the 14-Day Rolling VWAP, but the index is now approaching the Daily 200 EMA, which aligns closely with the descending trendline.
This creates an important decision zone for the next session.
Key Levels
🟢 Support
24,070 – 14-Day Rolling VWAP
24,065 – Weekly Rolling VWAP (15-minute)
24,040 – Lower Balance Zone
23,817 – Immediate support
23,606 – Rising trendline support
🔴 Resistance
24,369 – Daily 200 EMA
Descending trendline
24,602 – Previous swing high
24,698 – Upper Balance Zone
What to Watch Tomorrow
🟢 Bullish Scenario
If buyers reclaim and sustain above the Daily 200 EMA (24,369), the breakout could open the path toward 24,602. Acceptance above this level would bring the Upper Balance Zone (24,698) into focus and further strengthen the short-term structure.
🔴 Bearish Scenario
If sellers defend the 200 EMA and the descending trendline, watch the 24,070–24,040 support cluster closely. This area combines the 14-Day Rolling VWAP, Weekly Rolling VWAP, and the Lower Balance Zone. A loss of this zone could lead to a pullback toward 23,817, while a break below that would shift attention back to the rising trendline near 23,606.
Market Structure
The previous analysis correctly identified the rising trendline as the key support, and today's session confirmed its importance. The short-term structure has improved with the recovery above the 50 EMA and the 14-Day Rolling VWAP, but the Daily 200 EMA and the descending trendline remain the next major hurdles. Tomorrow's reaction around this resistance cluster is likely to determine whether the recovery extends or pauses.
Educational market structure discussion only. Not investment advice.
NIFTY respected the rising trendline highlighted in the previous analysis and delivered a strong recovery, confirming that buyers continue to defend the higher-low structure. The rally has successfully reclaimed the 50 EMA and moved back above the 14-Day Rolling VWAP, but the index is now approaching the Daily 200 EMA, which aligns closely with the descending trendline.
This creates an important decision zone for the next session.
Key Levels
🟢 Support
24,070 – 14-Day Rolling VWAP
24,065 – Weekly Rolling VWAP (15-minute)
24,040 – Lower Balance Zone
23,817 – Immediate support
23,606 – Rising trendline support
🔴 Resistance
24,369 – Daily 200 EMA
Descending trendline
24,602 – Previous swing high
24,698 – Upper Balance Zone
What to Watch Tomorrow
🟢 Bullish Scenario
If buyers reclaim and sustain above the Daily 200 EMA (24,369), the breakout could open the path toward 24,602. Acceptance above this level would bring the Upper Balance Zone (24,698) into focus and further strengthen the short-term structure.
🔴 Bearish Scenario
If sellers defend the 200 EMA and the descending trendline, watch the 24,070–24,040 support cluster closely. This area combines the 14-Day Rolling VWAP, Weekly Rolling VWAP, and the Lower Balance Zone. A loss of this zone could lead to a pullback toward 23,817, while a break below that would shift attention back to the rising trendline near 23,606.
Market Structure
The previous analysis correctly identified the rising trendline as the key support, and today's session confirmed its importance. The short-term structure has improved with the recovery above the 50 EMA and the 14-Day Rolling VWAP, but the Daily 200 EMA and the descending trendline remain the next major hurdles. Tomorrow's reaction around this resistance cluster is likely to determine whether the recovery extends or pauses.
Educational market structure discussion only. Not investment advice.
Nota
Update — Testing the 200 EMA Resistance Right Now
Quick update. Nifty has bounced back from the trendline support zone we were watching, and is now knocking right on the 200 EMA (24,368), currently trading at 24,366.55.
What's happening:
The trendline support held again — good sign, adds to its track record
Price has climbed back up and is facing resistance exactly at the 200 EMA (24,368)
There's also a broader resistance zone above (24,601–24,989) if this level clears
Multi-timeframe view on this zone:
On the daily chart, resistance lines up with the 14-day rolling VWAP (24,099) and the Upper Balance zone (24,697)
On the 15-min chart, support is showing up near the weekly rolling VWAP (24,088) and the Lower Balance zone (24,040)
What to watch next:
A close above 24,368 (200 EMA) would be the first sign buyers are gaining control here
If it fails and pulls back, watch the Support-on-Trendline zone (23,817) and Major Support (23,070) below
The bigger resistance zone (24,601–24,989) is still the tougher test even if the 200 EMA clears
Bottom line: Nifty is right at a key decision point — the 200 EMA. As always, we wait for a proper close above or below before assuming which way this goes.
For educational purposes only. Not financial advice. Always manage your risk.
Dagangan ditutup: sasaran tercapai
Update — Target Achieved ✅The original thesis flagged Nifty testing the Daily 200 EMA (24,369) and descending trendline resistance, with 24,602 and then 24,698 (Upper Balance Zone) as bullish targets if buyers reclaimed that zone.
They did. Nifty broke through the 200 EMA cluster and rallied to a high of 24,774.30 on Aug 3, clearing both target levels.
Closing this update here.

📈 HK Trading Community | Market Structure & Indicator Updates
Telegram: t.me/trendstrike1000
Website: quantumedgepro.netlify.app/
Real traders are built through learning,not tip hunting.So Start Learning How the Market Really Works
Telegram: t.me/trendstrike1000
Website: quantumedgepro.netlify.app/
Real traders are built through learning,not tip hunting.So Start Learning How the Market Really Works
Penerbitan berkaitan
Penafian
Maklumat dan penerbitan adalah tidak bertujuan, dan tidak membentuk, nasihat atau cadangan kewangan, pelaburan, dagangan atau jenis lain yang diberikan atau disahkan oleh TradingView. Baca lebih dalam Terma Penggunaan.
📈 HK Trading Community | Market Structure & Indicator Updates
Telegram: t.me/trendstrike1000
Website: quantumedgepro.netlify.app/
Real traders are built through learning,not tip hunting.So Start Learning How the Market Really Works
Telegram: t.me/trendstrike1000
Website: quantumedgepro.netlify.app/
Real traders are built through learning,not tip hunting.So Start Learning How the Market Really Works
Penerbitan berkaitan
Penafian
Maklumat dan penerbitan adalah tidak bertujuan, dan tidak membentuk, nasihat atau cadangan kewangan, pelaburan, dagangan atau jenis lain yang diberikan atau disahkan oleh TradingView. Baca lebih dalam Terma Penggunaan.