
🔎 Intro / Overview
This idea presents an EMA + RSI Alignment Framework designed to help traders understand market conditions rather than chase price movements.
Often, traders feel they have “missed the move”.
In most cases, this happens not because of late entries, but because market context was not clearly defined beforehand.
This framework focuses on evaluating trend direction and momentum quality first, so traders can better understand when conditions were supportive, unclear, or weakening.
⸻
📔 Concept
Indicators are frequently misused when applied in isolation.
This framework assigns clear and specific roles to each tool:
• EMA defines trend bias, not support or resistance.
• RSI measures momentum quality, not overbought or oversold levels.
A market environment is considered valid only when EMA and RSI are aligned.
When alignment is missing, price movement alone is treated as low-quality information.
This shifts focus away from prediction and toward environment assessment.
⸻
📌 How to Use
The framework is applied through three structured steps:
1. Identify Trend Bias (EMA)
• Price holding above EMA → bullish environment
• Price holding below EMA → bearish environment
• Price frequently crossing EMA → unstable environment
2. Assess Momentum Quality (RSI)
• RSI holding above 40 → supportive bullish momentum
• RSI holding below 60 → supportive bearish momentum
• RSI fluctuating around 50 → momentum instability
3. Confirm Alignment
• EMA + RSI aligned → valid market environment
• EMA + RSI misaligned → low-quality environment
This framework is used strictly for evaluation and learning, not execution.
⸻
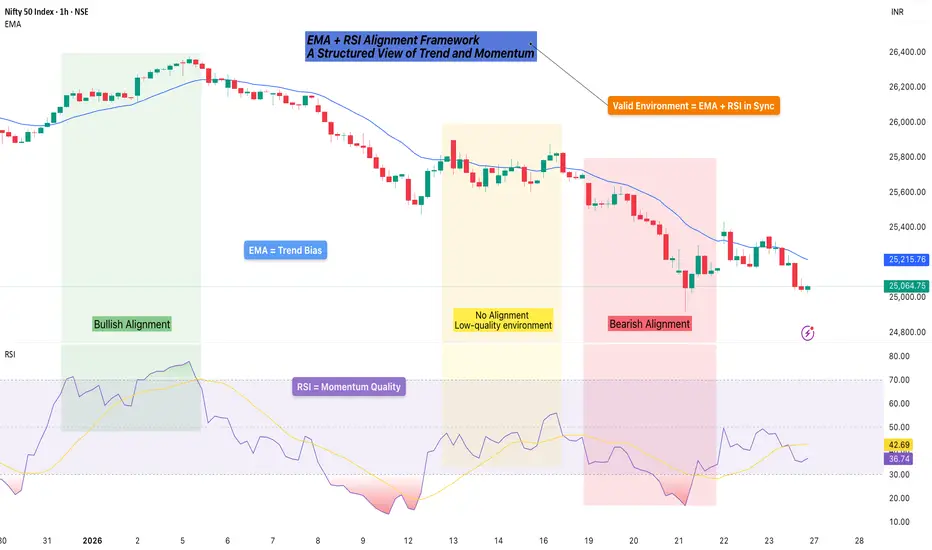
📊 Chart Explanation
• Bullish Alignment Zone
Price holds above EMA while RSI confirms stable bullish momentum.
• No Alignment Zone
EMA flattens and RSI becomes unstable, indicating a low-quality environment.
• Bearish Alignment Zone
Price holds below EMA while RSI confirms bearish momentum.
The RSI panel is used only for confirmation, never for signal generation.
⸻
👀 Observation
Many traders feel they missed a move only after alignment has already occurred.
This framework helps visualize:
• When alignment was present
• When conditions became unclear
• When momentum weakened
Understanding this sequence helps traders learn from price behavior instead of reacting emotionally to it.
⸻
❗ Why It Matters?
Market movement alone does not equal opportunity.
By learning to recognize alignment vs misalignment, traders can:
• Avoid chasing price after moves are over
• Stay out of choppy or unstable conditions
• Build patience and contextual awareness
Context is often the difference between consistency and frustration.
⸻
🎯 Conclusion
The EMA + RSI Alignment Framework is a context-first approach to understanding market behavior.
It does not attempt to forecast future price moves.
Instead, it explains why certain environments supported movement and why others did not.
This makes it a valuable educational tool for developing disciplined, structured market understanding.
⸻
⚠️ Disclaimer
📘 For educational purposes only.
🙅 Not SEBI registered.
❌ Not a buy/sell recommendation.
🧠 Purely a learning resource.
📊 Not financial advice.
This idea presents an EMA + RSI Alignment Framework designed to help traders understand market conditions rather than chase price movements.
Often, traders feel they have “missed the move”.
In most cases, this happens not because of late entries, but because market context was not clearly defined beforehand.
This framework focuses on evaluating trend direction and momentum quality first, so traders can better understand when conditions were supportive, unclear, or weakening.
⸻
📔 Concept
Indicators are frequently misused when applied in isolation.
This framework assigns clear and specific roles to each tool:
• EMA defines trend bias, not support or resistance.
• RSI measures momentum quality, not overbought or oversold levels.
A market environment is considered valid only when EMA and RSI are aligned.
When alignment is missing, price movement alone is treated as low-quality information.
This shifts focus away from prediction and toward environment assessment.
⸻
📌 How to Use
The framework is applied through three structured steps:
1. Identify Trend Bias (EMA)
• Price holding above EMA → bullish environment
• Price holding below EMA → bearish environment
• Price frequently crossing EMA → unstable environment
2. Assess Momentum Quality (RSI)
• RSI holding above 40 → supportive bullish momentum
• RSI holding below 60 → supportive bearish momentum
• RSI fluctuating around 50 → momentum instability
3. Confirm Alignment
• EMA + RSI aligned → valid market environment
• EMA + RSI misaligned → low-quality environment
This framework is used strictly for evaluation and learning, not execution.
⸻
📊 Chart Explanation
• Bullish Alignment Zone
Price holds above EMA while RSI confirms stable bullish momentum.
• No Alignment Zone
EMA flattens and RSI becomes unstable, indicating a low-quality environment.
• Bearish Alignment Zone
Price holds below EMA while RSI confirms bearish momentum.
The RSI panel is used only for confirmation, never for signal generation.
⸻
👀 Observation
Many traders feel they missed a move only after alignment has already occurred.
This framework helps visualize:
• When alignment was present
• When conditions became unclear
• When momentum weakened
Understanding this sequence helps traders learn from price behavior instead of reacting emotionally to it.
⸻
❗ Why It Matters?
Market movement alone does not equal opportunity.
By learning to recognize alignment vs misalignment, traders can:
• Avoid chasing price after moves are over
• Stay out of choppy or unstable conditions
• Build patience and contextual awareness
Context is often the difference between consistency and frustration.
⸻
🎯 Conclusion
The EMA + RSI Alignment Framework is a context-first approach to understanding market behavior.
It does not attempt to forecast future price moves.
Instead, it explains why certain environments supported movement and why others did not.
This makes it a valuable educational tool for developing disciplined, structured market understanding.
⸻
⚠️ Disclaimer
📘 For educational purposes only.
🙅 Not SEBI registered.
❌ Not a buy/sell recommendation.
🧠 Purely a learning resource.
📊 Not financial advice.

Pine Script Developer • Market Analysis
Penafian
Maklumat dan penerbitan adalah tidak bertujuan, dan tidak membentuk, nasihat atau cadangan kewangan, pelaburan, dagangan atau jenis lain yang diberikan atau disahkan oleh TradingView. Baca lebih dalam Terma Penggunaan.
Pine Script Developer • Market Analysis
Penafian
Maklumat dan penerbitan adalah tidak bertujuan, dan tidak membentuk, nasihat atau cadangan kewangan, pelaburan, dagangan atau jenis lain yang diberikan atau disahkan oleh TradingView. Baca lebih dalam Terma Penggunaan.