 S&P CNX NIFTY INDEX FUTURESTelah dikemas kini
 Nifty Tests Major Yearly Support — Next 3 Expiry Sessions Key
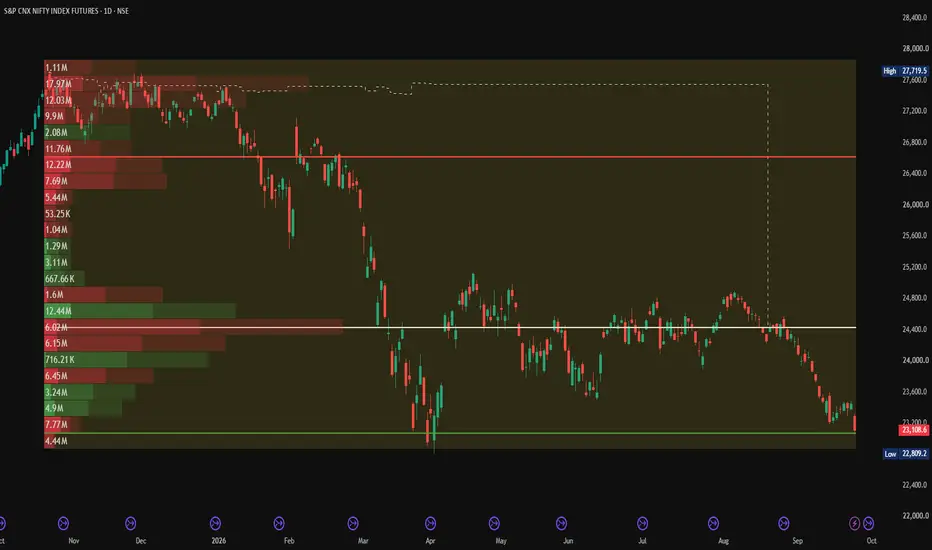
Nifty futures have fallen sharply into the last 3 sessions of September expiry, now trading near 23,108, down 341 points (-1.46%) today. Zooming out to the full one-year chart tells us something important: this isn't a fall into empty space — price is now testing a major long-term support zone that has held multiple times over the past year.
The Big Picture (1-Year View):
Looking at the volume profile from November 2025 to now, there's a clear support shelf sitting around 22,809–23,230 — this zone has attracted heavy trading activity in the past and has acted as a floor before. Compare that to where price fell from: the all-time high near 27,720, and the recent range high around 26,700. So while today's drop feels sharp in the short term, price is landing right on a level that has real trading history behind it — not just falling into thin air.
In simple terms:
Think of this support zone like a mattress that's caught the market's fall before. It doesn't guarantee a bounce, but it's a much more meaningful level to watch than a random number — because real buying and selling has happened here in the past.
Now, Zooming Into the Next 3 Expiry Sessions:
This is where the short-term delta view (buy vs. sell pressure) becomes useful. On the recent daily chart:
23,380–23,450 showed genuine buying pressure (green delta) even during sideways consolidation — this is the first real demand zone above current price
24,050–24,100 showed persistent selling pressure (red delta) — likely resistance if price attempts a bounce
Below current price, down toward the 22,809–23,230 major support, there's very little trading history in between — so a further slide could move quickly if this zone doesn't hold
What to watch over the next 3 sessions:
If price holds above the 22,809–23,230 major support zone → watch for a reclaim of 23,380–23,450 with renewed buying pressure as the first sign of a bounce, with 24,050–24,100 as the level that would need to be cleared next
If price breaks below 22,809 with strong selling pressure → this would mean the major yearly support has failed, and there's little historical trading data below to slow the next leg down
Bottom line:
Nifty is now testing one of its most important support zones of the past year, right into expiry. The next 3 sessions matter — either buyers defend this level (using 23,380–23,450 as the first confirmation), or a clean break below 22,809 opens the door to a deeper, faster move with little support in between.
This is for educational purposes only and not investment advice. Please do your own research or consult a financial advisor before making trading decisions.
The Big Picture (1-Year View):
Looking at the volume profile from November 2025 to now, there's a clear support shelf sitting around 22,809–23,230 — this zone has attracted heavy trading activity in the past and has acted as a floor before. Compare that to where price fell from: the all-time high near 27,720, and the recent range high around 26,700. So while today's drop feels sharp in the short term, price is landing right on a level that has real trading history behind it — not just falling into thin air.
In simple terms:
Think of this support zone like a mattress that's caught the market's fall before. It doesn't guarantee a bounce, but it's a much more meaningful level to watch than a random number — because real buying and selling has happened here in the past.
Now, Zooming Into the Next 3 Expiry Sessions:
This is where the short-term delta view (buy vs. sell pressure) becomes useful. On the recent daily chart:
23,380–23,450 showed genuine buying pressure (green delta) even during sideways consolidation — this is the first real demand zone above current price
24,050–24,100 showed persistent selling pressure (red delta) — likely resistance if price attempts a bounce
Below current price, down toward the 22,809–23,230 major support, there's very little trading history in between — so a further slide could move quickly if this zone doesn't hold
What to watch over the next 3 sessions:
If price holds above the 22,809–23,230 major support zone → watch for a reclaim of 23,380–23,450 with renewed buying pressure as the first sign of a bounce, with 24,050–24,100 as the level that would need to be cleared next
If price breaks below 22,809 with strong selling pressure → this would mean the major yearly support has failed, and there's little historical trading data below to slow the next leg down
Bottom line:
Nifty is now testing one of its most important support zones of the past year, right into expiry. The next 3 sessions matter — either buyers defend this level (using 23,380–23,450 as the first confirmation), or a clean break below 22,809 opens the door to a deeper, faster move with little support in between.
This is for educational purposes only and not investment advice. Please do your own research or consult a financial advisor before making trading decisions.
Dagangan ditutup: sasaran tercapai
The major yearly support zone (22,809–23,230) has failed. Nifty closed the week at 22,421.95, down 718.55 points (-3.11%), with a low of 22,217.30 — well below the entire support zone flagged in this idea. The bullish reclaim scenario (23,380–23,450) was never triggered.As noted at the time, a break below 22,809 meant little historical support remained below — and that's now the case, with price approaching the 22,182 level from the shorter-term Fib extension. This idea is now closed.
This is for educational purposes only and not investment advice.

📈 HK Trading Community | Market Structure & Indicator Updates
Telegram: t.me/trendstrike1000
Website: quantumedgepro.netlify.app/
Real traders are built through learning,not tip hunting.So Start Learning How the Market Really Works
Telegram: t.me/trendstrike1000
Website: quantumedgepro.netlify.app/
Real traders are built through learning,not tip hunting.So Start Learning How the Market Really Works
Penerbitan berkaitan
Penafian
Maklumat dan penerbitan adalah tidak bertujuan, dan tidak membentuk, nasihat atau cadangan kewangan, pelaburan, dagangan atau jenis lain yang diberikan atau disahkan oleh TradingView. Baca lebih dalam Terma Penggunaan.
📈 HK Trading Community | Market Structure & Indicator Updates
Telegram: t.me/trendstrike1000
Website: quantumedgepro.netlify.app/
Real traders are built through learning,not tip hunting.So Start Learning How the Market Really Works
Telegram: t.me/trendstrike1000
Website: quantumedgepro.netlify.app/
Real traders are built through learning,not tip hunting.So Start Learning How the Market Really Works
Penerbitan berkaitan
Penafian
Maklumat dan penerbitan adalah tidak bertujuan, dan tidak membentuk, nasihat atau cadangan kewangan, pelaburan, dagangan atau jenis lain yang diberikan atau disahkan oleh TradingView. Baca lebih dalam Terma Penggunaan.