
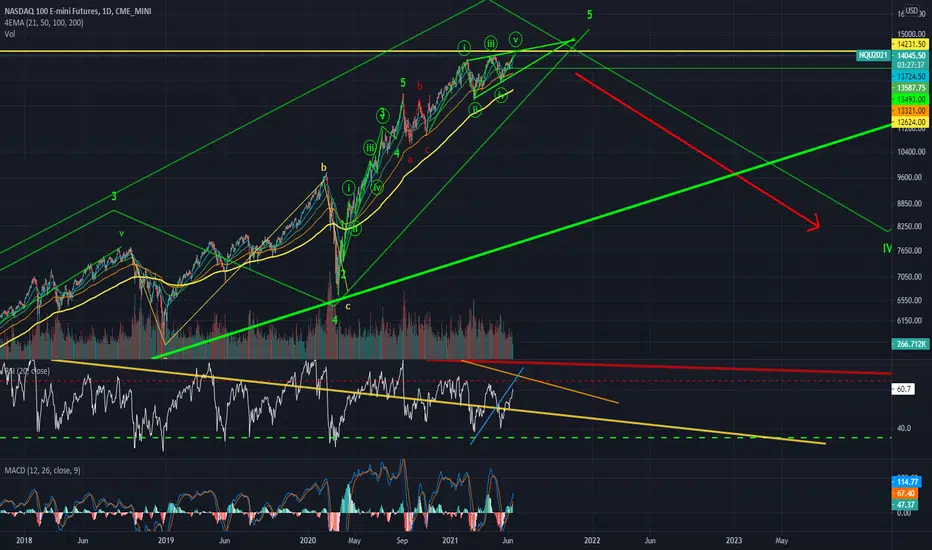
Tracking this formation as an ending diagonal.
This might be THE ending diagonal.
The ending point can be a higher high or lower one.
Many times you'll see a bump up above the top of the diagonal before it crashes back through.
*Note: This is the exact same formation Bitcoin had a few months ago before it crashed 50%. The relation is palpable.
I see Bitcoin as the honest player in the game as far as price action and patterns go. Look at the two charts.
Diagonal remains valid unless be break above 15,000.
This might be THE ending diagonal.
The ending point can be a higher high or lower one.
Many times you'll see a bump up above the top of the diagonal before it crashes back through.
*Note: This is the exact same formation Bitcoin had a few months ago before it crashed 50%. The relation is palpable.
I see Bitcoin as the honest player in the game as far as price action and patterns go. Look at the two charts.
Diagonal remains valid unless be break above 15,000.
Nota

Penafian
Maklumat dan penerbitan adalah tidak bertujuan, dan tidak membentuk, nasihat atau cadangan kewangan, pelaburan, dagangan atau jenis lain yang diberikan atau disahkan oleh TradingView. Baca lebih dalam Terma Penggunaan.
Penafian
Maklumat dan penerbitan adalah tidak bertujuan, dan tidak membentuk, nasihat atau cadangan kewangan, pelaburan, dagangan atau jenis lain yang diberikan atau disahkan oleh TradingView. Baca lebih dalam Terma Penggunaan.