
Together with you, Butopia is building a Utopia of Wealth based not on intuition, but on clear standards and structure.
Let’s begin the NVIDIA chart analysis for March 22.

📊 Weekly Chart Analysis – Testing a Key Support Zone
First, from the weekly timeframe:
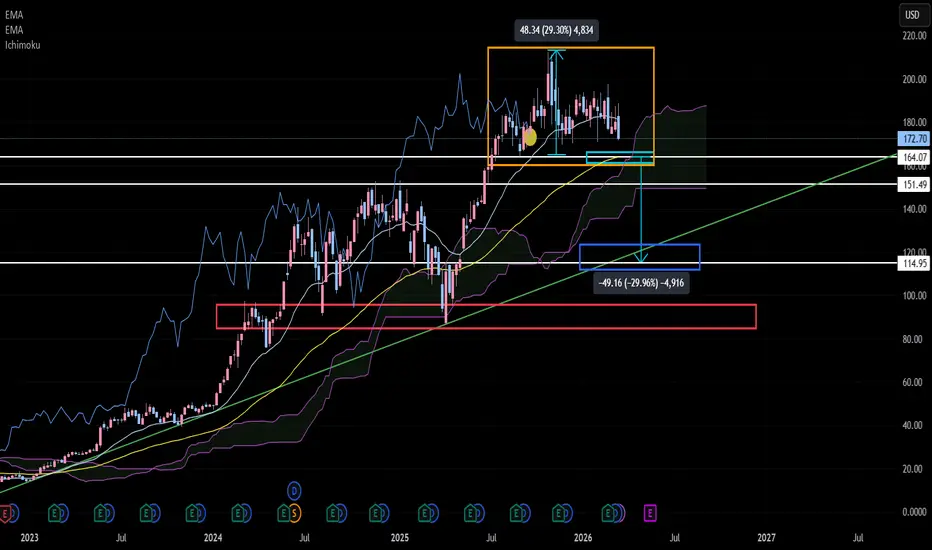
NVIDIA is currently moving sideways within an orange box range, forming a clear structural framework.
Within this range, the most critical level is 164, which is acting as a major support zone.
If we interpret 164 as a neckline, we can observe that in the past, the price moved approximately +30% from this level.
Applying the same logic:
👉 If 164 breaks down, the projected downside target becomes approximately 114.
Notably, the 114 level aligns with a long-term ascending trendline that has been in place since 2023, making it a technically significant support area.
📉 Bearish Signals – Lagging Span & Weekly Structure
Another key factor to monitor is the Lagging Span (Chikou Span), highlighted in the yellow circle.
The lagging span has now moved below the weekly price candles,
which is typically interpreted as a bearish or corrective signal on the weekly timeframe.
Additionally:
👉 Since September 2025, the current weekly close represents the lowest level in that period.
This suggests that the market may be gradually shifting into a weaker structure.
🟢 Buy Strategy – Tiered Accumulation Approach
At this stage, the market is not in a confirmed uptrend.
Instead, it is in a support-testing phase with downside risk still open.
Therefore, a step-by-step accumulation strategy after confirmation is more appropriate.
1️⃣ Primary Buy Scenario
Monitor whether the 164 support breaks
If price falls below 151 and enters the weekly Ichimoku cloud
👉 In this case, there is a high probability of a move toward 115
→ Therefore, the 115 area (near the weekly ascending trendline) can be considered a first accumulation zone
2️⃣ Secondary Buy Scenario
If further downside continues:
👉 92 – 87 range (red box)
→ This zone can be considered a strong long-term support area
and a secondary accumulation zone
📌 Conclusion
NVIDIA is currently at a critical decision point centered around the 164 support level on the weekly timeframe.
Key takeaways:
164 → Key support / neckline
Breakdown → Potential move toward 114
Lagging Span below price → Weekly correction signal
Weakening structure based on recent weekly closes
At this stage, rather than aggressively chasing the market:
👉 It is more rational to wait for confirmation of support breakdown and apply a phased buying strategy at key levels.
Not intuition—
but structure and levels.
Let’s begin the NVIDIA chart analysis for March 22.
📊 Weekly Chart Analysis – Testing a Key Support Zone
First, from the weekly timeframe:
NVIDIA is currently moving sideways within an orange box range, forming a clear structural framework.
Within this range, the most critical level is 164, which is acting as a major support zone.
If we interpret 164 as a neckline, we can observe that in the past, the price moved approximately +30% from this level.
Applying the same logic:
👉 If 164 breaks down, the projected downside target becomes approximately 114.
Notably, the 114 level aligns with a long-term ascending trendline that has been in place since 2023, making it a technically significant support area.
📉 Bearish Signals – Lagging Span & Weekly Structure
Another key factor to monitor is the Lagging Span (Chikou Span), highlighted in the yellow circle.
The lagging span has now moved below the weekly price candles,
which is typically interpreted as a bearish or corrective signal on the weekly timeframe.
Additionally:
👉 Since September 2025, the current weekly close represents the lowest level in that period.
This suggests that the market may be gradually shifting into a weaker structure.
🟢 Buy Strategy – Tiered Accumulation Approach
At this stage, the market is not in a confirmed uptrend.
Instead, it is in a support-testing phase with downside risk still open.
Therefore, a step-by-step accumulation strategy after confirmation is more appropriate.
1️⃣ Primary Buy Scenario
Monitor whether the 164 support breaks
If price falls below 151 and enters the weekly Ichimoku cloud
👉 In this case, there is a high probability of a move toward 115
→ Therefore, the 115 area (near the weekly ascending trendline) can be considered a first accumulation zone
2️⃣ Secondary Buy Scenario
If further downside continues:
👉 92 – 87 range (red box)
→ This zone can be considered a strong long-term support area
and a secondary accumulation zone
📌 Conclusion
NVIDIA is currently at a critical decision point centered around the 164 support level on the weekly timeframe.
Key takeaways:
164 → Key support / neckline
Breakdown → Potential move toward 114
Lagging Span below price → Weekly correction signal
Weakening structure based on recent weekly closes
At this stage, rather than aggressively chasing the market:
👉 It is more rational to wait for confirmation of support breakdown and apply a phased buying strategy at key levels.
Not intuition—
but structure and levels.

Penafian
Maklumat dan penerbitan adalah tidak bertujuan, dan tidak membentuk, nasihat atau cadangan kewangan, pelaburan, dagangan atau jenis lain yang diberikan atau disahkan oleh TradingView. Baca lebih dalam Terma Penggunaan.
Penafian
Maklumat dan penerbitan adalah tidak bertujuan, dan tidak membentuk, nasihat atau cadangan kewangan, pelaburan, dagangan atau jenis lain yang diberikan atau disahkan oleh TradingView. Baca lebih dalam Terma Penggunaan.