Ocean chart analysis
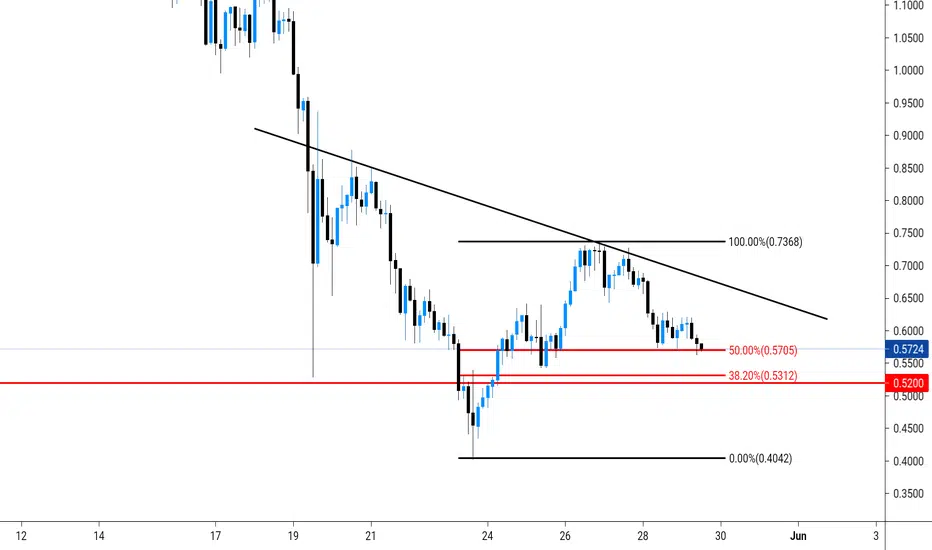
#OCEAN 3H USDT CHART ANALYSIS...
Ocean Now Just Above It's Weekly Strong Support Zone. If It's Can't Hold This Level, It Will Be More Bad For Ocean. So Weekly Candle Should Be Close Above Thid Support Zone 0.52$. On The Other Side It's Creating A Inverse Head & Shoulder Pattern. You Can Buy After Breakout The Neckline.
Short Term Trader Always Stop-loss. Invest How Much You Can Afford To Loss. Always Verify Your Own Analysis.
Ocean Now Just Above It's Weekly Strong Support Zone. If It's Can't Hold This Level, It Will Be More Bad For Ocean. So Weekly Candle Should Be Close Above Thid Support Zone 0.52$. On The Other Side It's Creating A Inverse Head & Shoulder Pattern. You Can Buy After Breakout The Neckline.
Short Term Trader Always Stop-loss. Invest How Much You Can Afford To Loss. Always Verify Your Own Analysis.

Penafian
Maklumat dan penerbitan adalah tidak bertujuan, dan tidak membentuk, nasihat atau cadangan kewangan, pelaburan, dagangan atau jenis lain yang diberikan atau disahkan oleh TradingView. Baca lebih dalam Terma Penggunaan.
Penafian
Maklumat dan penerbitan adalah tidak bertujuan, dan tidak membentuk, nasihat atau cadangan kewangan, pelaburan, dagangan atau jenis lain yang diberikan atau disahkan oleh TradingView. Baca lebih dalam Terma Penggunaan.