
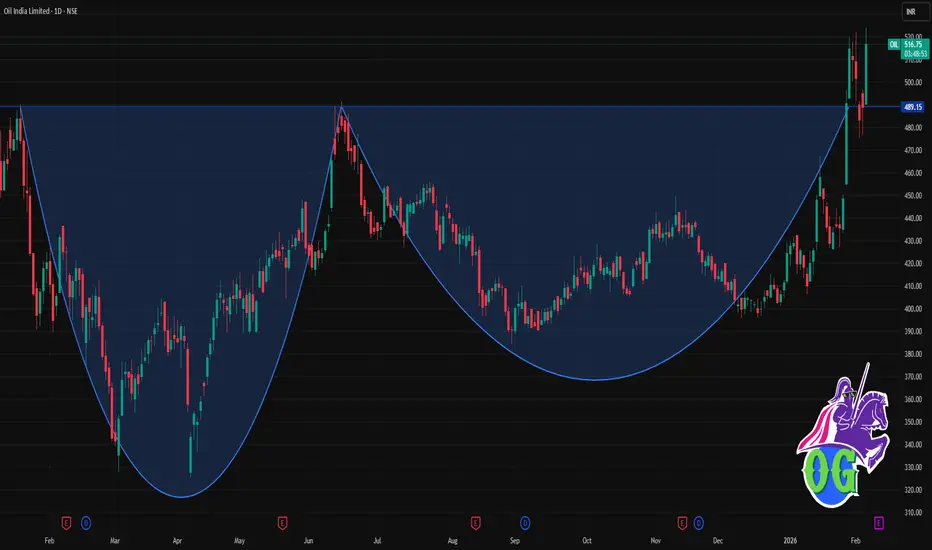
📊 Current Approx Price (as per today data): ₹488.90 – ₹514.4 range (varies by platform/time) — OIL has recently traded around this area near daily pivot/major levels.
📈 Daily Pivot & Key Levels (Classic method)
Level Price (₹) Role
R3 (3rd Resistance) 507.45 Strong upside hurdle
R2 499.40 Secondary resistance
R1 491.35 Near-term resistance
Daily Pivot 483.30 Trend bias line
S1 (1st Support) 475.25 Immediate support
S2 467.20 Next downside cushion
S3 459.15 Major support zone
👉 Interpretation (1-day frame):
Price above pivot (~483-484) = bullish bias on the daily.
Near-term resistance cluster: ₹491–₹499–₹507 — watch breakout closes above these for continuation.
Downside support cluster: ₹475 → ₹467 → ₹459 — breakdown below these suggests short-term correction.
📊 Short Summary (Daily Momentum & Indicators)
Technical bias:
• RSI near bullish/neutral zone — showing positive momentum without being extremely overbought.
• MACD / ADX generally leaning bullish indicating trend strength at the moment.
Overall daily structure favors bullish to sideways — supports holding and resistance being tested.
🧠 How to use these levels (Daily)
📍 Bullish setup:
• If price stays above pivot ~483 and holds above R1 (~491) → next target R2 ~499 → R3 ~507.
📍 Bearish setup:
• If price falls below pivot ~483 and breaks S1 (~475) → move down to S2 (467) & potentially S3 (459).
📍 Key breakouts:
• Clear daily close above 507 → strong bull confirmation.
• Close below 459 → negates short-term bull view.
📈 Daily Pivot & Key Levels (Classic method)
Level Price (₹) Role
R3 (3rd Resistance) 507.45 Strong upside hurdle
R2 499.40 Secondary resistance
R1 491.35 Near-term resistance
Daily Pivot 483.30 Trend bias line
S1 (1st Support) 475.25 Immediate support
S2 467.20 Next downside cushion
S3 459.15 Major support zone
👉 Interpretation (1-day frame):
Price above pivot (~483-484) = bullish bias on the daily.
Near-term resistance cluster: ₹491–₹499–₹507 — watch breakout closes above these for continuation.
Downside support cluster: ₹475 → ₹467 → ₹459 — breakdown below these suggests short-term correction.
📊 Short Summary (Daily Momentum & Indicators)
Technical bias:
• RSI near bullish/neutral zone — showing positive momentum without being extremely overbought.
• MACD / ADX generally leaning bullish indicating trend strength at the moment.
Overall daily structure favors bullish to sideways — supports holding and resistance being tested.
🧠 How to use these levels (Daily)
📍 Bullish setup:
• If price stays above pivot ~483 and holds above R1 (~491) → next target R2 ~499 → R3 ~507.
📍 Bearish setup:
• If price falls below pivot ~483 and breaks S1 (~475) → move down to S2 (467) & potentially S3 (459).
📍 Key breakouts:
• Clear daily close above 507 → strong bull confirmation.
• Close below 459 → negates short-term bull view.

Contact Knowledgehub for a detailed consultation: Dm on WhatsApp: [wa.link/a2o0kz]-
Phone No: [+91 93102 26243]-
Email: [tradingviewknowledgehub@gmail.com]---
-- Let’s achieve success together!
Phone No: [+91 93102 26243]-
Email: [tradingviewknowledgehub@gmail.com]---
-- Let’s achieve success together!
Penerbitan berkaitan
Penafian
Maklumat dan penerbitan adalah tidak bertujuan, dan tidak membentuk, nasihat atau cadangan kewangan, pelaburan, dagangan atau jenis lain yang diberikan atau disahkan oleh TradingView. Baca lebih dalam Terma Penggunaan.
Contact Knowledgehub for a detailed consultation: Dm on WhatsApp: [wa.link/a2o0kz]-
Phone No: [+91 93102 26243]-
Email: [tradingviewknowledgehub@gmail.com]---
-- Let’s achieve success together!
Phone No: [+91 93102 26243]-
Email: [tradingviewknowledgehub@gmail.com]---
-- Let’s achieve success together!
Penerbitan berkaitan
Penafian
Maklumat dan penerbitan adalah tidak bertujuan, dan tidak membentuk, nasihat atau cadangan kewangan, pelaburan, dagangan atau jenis lain yang diberikan atau disahkan oleh TradingView. Baca lebih dalam Terma Penggunaan.