
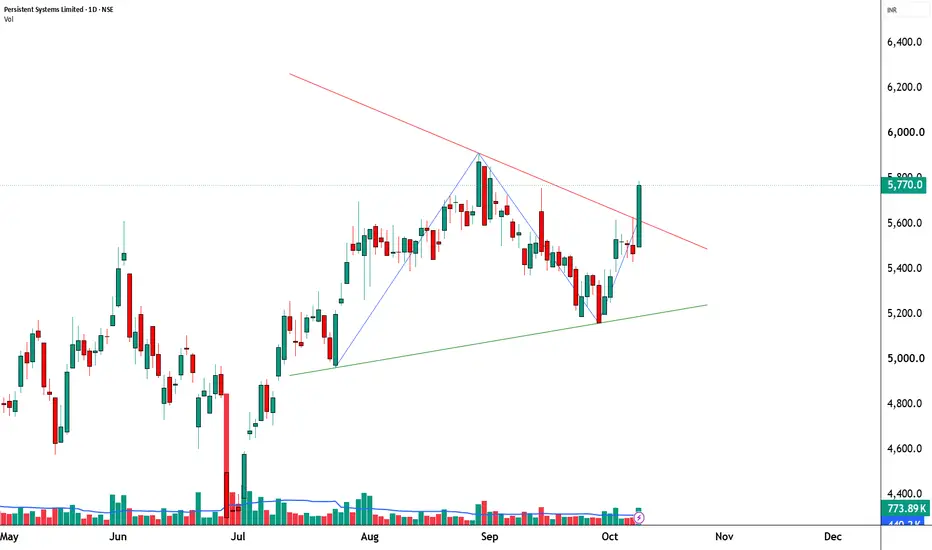
🔥 Persistent Systems: Symmetrical Triangle Breakout with Strong Volume
📊 MARKET STRUCTURE SNAPSHOT | NSE: PERSISTENT | DAILY
Closing Price: 5,770.00 (+5.52%)
Core Trend: Bullish
Market State: Range Expansion / Breakout Attempt
Chart Pattern: Symmetrical Triangle — Bullish Breakout Attempt
Candlestick Pattern: Strong Bullish Candle
Price Structure: Price has moved sharply above the descending upper boundary of a multi-week symmetrical triangle, following a recovery from the rising lower boundary. The latest candle shows a strong expansion beyond the recent consolidation range.
Technicals: RSI 63.08 — bullish momentum
Volume: 773.89K vs 440.20K average — approximately 1.76× average
Moving Average Structure: Bullish bias; price above the displayed 9, 21, 50, 100 and 200 EMAs
CPR & Market Structure: Bullish Zone — Wide CPR
Range Status: No special edge
Next Session CPR: Wide — Pivot 5,686 | Top 5,728 | Base 5,644
Model Reference: 5,789
Observation References: 6,156.50 6,523.50 6,891.00
Support References: 5,583 5,396 5,293
📚 STWP EDUCATIONAL OBSERVATION
Persistent Systems is displaying a potential bullish resolution of a symmetrical triangle, with the latest daily candle closing at 5,770, up 5.52%, and moving above the pattern’s descending boundary. Volume reached 773.89K, approximately 1.76 times the displayed average of 440.20K, indicating stronger participation during the move. RSI at 63.08 supports the positive momentum reading, while price remains above the displayed major EMAs, preserving the broader bullish structure. The 5,789–5,873 area is an important near-term reference region for observing whether the breakout sustains or encounters resistance. The 5,583 area and the lower references at 5,396 and 5,293 provide context for evaluating subsequent price structure. Although the breakout candle is strong, follow-through and price behaviour around the former triangle boundary will help establish whether the move represents a sustained breakout or a temporary expansion.
📚 STWP EDUCATIONAL NOTE
This content is provided strictly for educational and informational purposes only.
The information presented should not be construed as investment advice, research advice, financial advice, a recommendation, solicitation or an offer to buy, sell or hold any security.
Technical analysis and historical price behaviour cannot guarantee or predict future market performance. STWP and the author make no representation or guarantee regarding future price movements, returns, performance or outcomes. Past performance is not indicative of future results.
Kindly consult an appropriately SEBI-registered investment professional.
📊 MARKET STRUCTURE SNAPSHOT | NSE: PERSISTENT | DAILY
Closing Price: 5,770.00 (+5.52%)
Core Trend: Bullish
Market State: Range Expansion / Breakout Attempt
Chart Pattern: Symmetrical Triangle — Bullish Breakout Attempt
Candlestick Pattern: Strong Bullish Candle
Price Structure: Price has moved sharply above the descending upper boundary of a multi-week symmetrical triangle, following a recovery from the rising lower boundary. The latest candle shows a strong expansion beyond the recent consolidation range.
Technicals: RSI 63.08 — bullish momentum
Volume: 773.89K vs 440.20K average — approximately 1.76× average
Moving Average Structure: Bullish bias; price above the displayed 9, 21, 50, 100 and 200 EMAs
CPR & Market Structure: Bullish Zone — Wide CPR
Range Status: No special edge
Next Session CPR: Wide — Pivot 5,686 | Top 5,728 | Base 5,644
Model Reference: 5,789
Observation References: 6,156.50 6,523.50 6,891.00
Support References: 5,583 5,396 5,293
📚 STWP EDUCATIONAL OBSERVATION
Persistent Systems is displaying a potential bullish resolution of a symmetrical triangle, with the latest daily candle closing at 5,770, up 5.52%, and moving above the pattern’s descending boundary. Volume reached 773.89K, approximately 1.76 times the displayed average of 440.20K, indicating stronger participation during the move. RSI at 63.08 supports the positive momentum reading, while price remains above the displayed major EMAs, preserving the broader bullish structure. The 5,789–5,873 area is an important near-term reference region for observing whether the breakout sustains or encounters resistance. The 5,583 area and the lower references at 5,396 and 5,293 provide context for evaluating subsequent price structure. Although the breakout candle is strong, follow-through and price behaviour around the former triangle boundary will help establish whether the move represents a sustained breakout or a temporary expansion.
📚 STWP EDUCATIONAL NOTE
This content is provided strictly for educational and informational purposes only.
The information presented should not be construed as investment advice, research advice, financial advice, a recommendation, solicitation or an offer to buy, sell or hold any security.
Technical analysis and historical price behaviour cannot guarantee or predict future market performance. STWP and the author make no representation or guarantee regarding future price movements, returns, performance or outcomes. Past performance is not indicative of future results.
Kindly consult an appropriately SEBI-registered investment professional.

STWP | Mentor & Demand-Supply Specialist |
Empowering traders through structured learning |
simpletradewithpatience.com
chat.whatsapp.com/CpgyHCfioQ5Hxf7rd8pDqw
wa.me/message/6IOPHGOXMGZ4N1
Educational Only
Empowering traders through structured learning |
simpletradewithpatience.com
chat.whatsapp.com/CpgyHCfioQ5Hxf7rd8pDqw
wa.me/message/6IOPHGOXMGZ4N1
Educational Only
Penafian
Maklumat dan penerbitan adalah tidak bertujuan, dan tidak membentuk, nasihat atau cadangan kewangan, pelaburan, dagangan atau jenis lain yang diberikan atau disahkan oleh TradingView. Baca lebih dalam Terma Penggunaan.
STWP | Mentor & Demand-Supply Specialist |
Empowering traders through structured learning |
simpletradewithpatience.com
chat.whatsapp.com/CpgyHCfioQ5Hxf7rd8pDqw
wa.me/message/6IOPHGOXMGZ4N1
Educational Only
Empowering traders through structured learning |
simpletradewithpatience.com
chat.whatsapp.com/CpgyHCfioQ5Hxf7rd8pDqw
wa.me/message/6IOPHGOXMGZ4N1
Educational Only
Penafian
Maklumat dan penerbitan adalah tidak bertujuan, dan tidak membentuk, nasihat atau cadangan kewangan, pelaburan, dagangan atau jenis lain yang diberikan atau disahkan oleh TradingView. Baca lebih dalam Terma Penggunaan.