
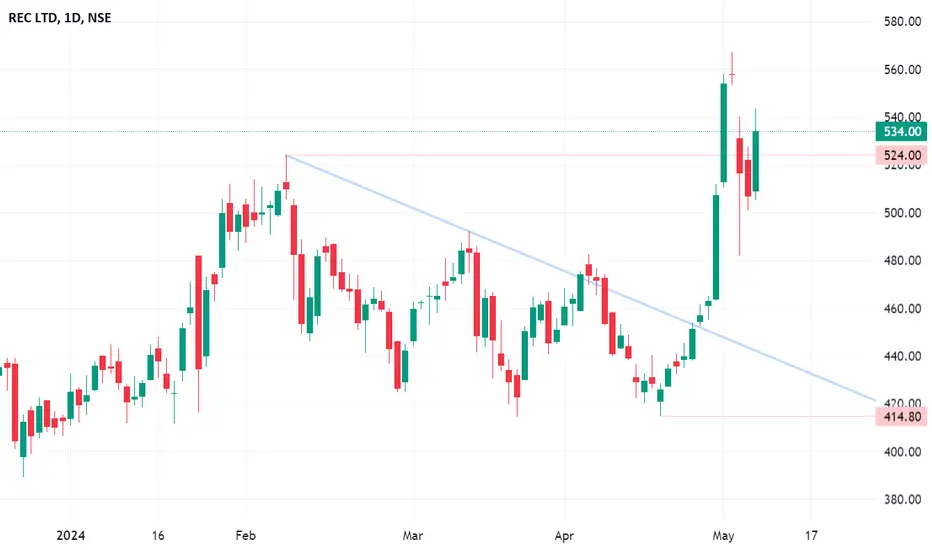
There are 2 points to be noticed in the daily chart of REC Ltd
1. There was a breakout from the downtrend on 26th April
2. The resistance was broken on 2nd May but then we saw a selling pressure in the stock but the candle made today is a decent bullish candle and this could be a breakout as well.
Can buy for targets of 570 & 590.
Educational purpose only
1. There was a breakout from the downtrend on 26th April
2. The resistance was broken on 2nd May but then we saw a selling pressure in the stock but the candle made today is a decent bullish candle and this could be a breakout as well.
Can buy for targets of 570 & 590.
Educational purpose only

Penafian
Maklumat dan penerbitan adalah tidak bertujuan, dan tidak membentuk, nasihat atau cadangan kewangan, pelaburan, dagangan atau jenis lain yang diberikan atau disahkan oleh TradingView. Baca lebih dalam Terma Penggunaan.
Penafian
Maklumat dan penerbitan adalah tidak bertujuan, dan tidak membentuk, nasihat atau cadangan kewangan, pelaburan, dagangan atau jenis lain yang diberikan atau disahkan oleh TradingView. Baca lebih dalam Terma Penggunaan.