
1. Price Action and Trend Structure
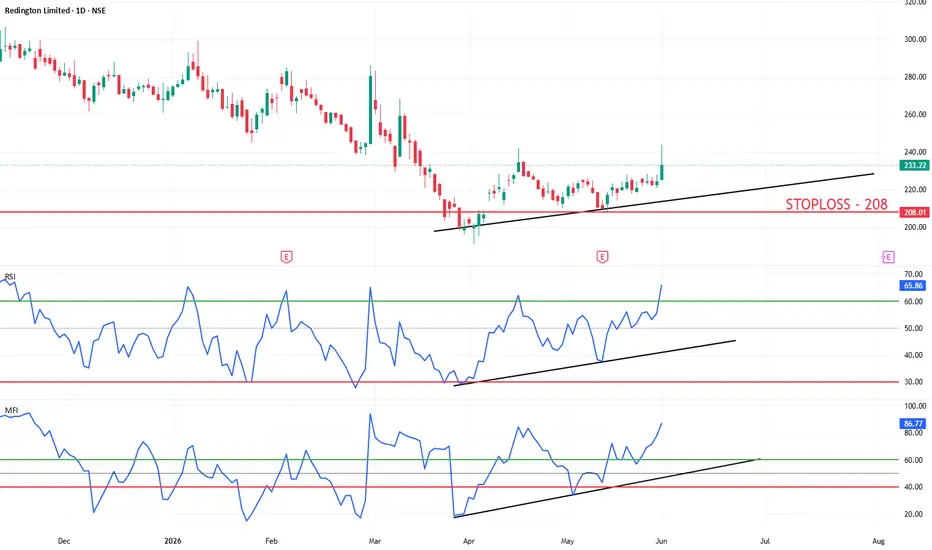
The Setup: The daily chart illustrates a clear structural shift. After a markdown phase earlier in the year, the stock found a bottom in late March/early April. Since then, it has been printing higher lows. The black ascending trendline correctly captures this new upward trajectory, acting as dynamic support.
Current Move: The most recent daily candle (closing at 233.22, up 3.96%) is a strong, full-bodied bullish candle. It demonstrates aggressive buying pressure, signaling a potential breakout from the recent short-term consolidation.
2. Momentum and Volume Indicators
RSI (Relative Strength Index): The RSI is currently at 65.86. The ascending trendline drawn on the RSI confirms that momentum is increasing alongside the price (no bearish divergence). At ~66, it is in strong bullish territory, with some room left before hitting the traditional overbought threshold of 70.
MFI (Money Flow Index): The MFI is currently at 86.77. The rising trendline here validates that the price increase is being supported by significant capital inflows (volume). Note: An MFI above 80 is considered heavily overbought. While this highlights massive buying interest, it also suggests the stock might need to digest these gains with a brief consolidation or minor pullback soon.
The Setup: The daily chart illustrates a clear structural shift. After a markdown phase earlier in the year, the stock found a bottom in late March/early April. Since then, it has been printing higher lows. The black ascending trendline correctly captures this new upward trajectory, acting as dynamic support.
Current Move: The most recent daily candle (closing at 233.22, up 3.96%) is a strong, full-bodied bullish candle. It demonstrates aggressive buying pressure, signaling a potential breakout from the recent short-term consolidation.
2. Momentum and Volume Indicators
RSI (Relative Strength Index): The RSI is currently at 65.86. The ascending trendline drawn on the RSI confirms that momentum is increasing alongside the price (no bearish divergence). At ~66, it is in strong bullish territory, with some room left before hitting the traditional overbought threshold of 70.
MFI (Money Flow Index): The MFI is currently at 86.77. The rising trendline here validates that the price increase is being supported by significant capital inflows (volume). Note: An MFI above 80 is considered heavily overbought. While this highlights massive buying interest, it also suggests the stock might need to digest these gains with a brief consolidation or minor pullback soon.

Penafian
Maklumat dan penerbitan adalah tidak bertujuan, dan tidak membentuk, nasihat atau cadangan kewangan, pelaburan, dagangan atau jenis lain yang diberikan atau disahkan oleh TradingView. Baca lebih dalam Terma Penggunaan.
Penafian
Maklumat dan penerbitan adalah tidak bertujuan, dan tidak membentuk, nasihat atau cadangan kewangan, pelaburan, dagangan atau jenis lain yang diberikan atau disahkan oleh TradingView. Baca lebih dalam Terma Penggunaan.