
RELIANCE: Falling Wedge Bullish Reversal at Strong Support ₹1469
Technical Analysis
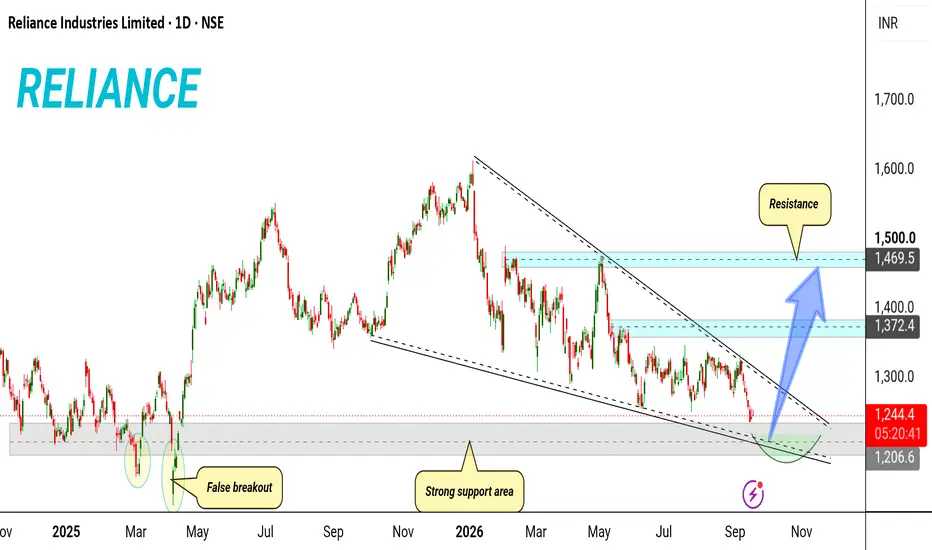
Pattern Formation: The 1-Day chart of Reliance Industries Limited (RELIANCE) displays a multi-month Falling Wedge pattern. Lower highs and lower lows are gradually narrowing toward a technical apex, indicating seller exhaustion.
Support Zone: Price action is testing a major Strong Support Area around ₹1,200 – ₹1,210. This zone aligns with past macro swing lows and includes a recorded False Breakout / Liquidity Sweep (under ₹1,200), signaling strong institutional buying defense.
Accumulation / Spring: The chart highlights a rounded accumulation curve (green shade) emerging from the lower trendline of the wedge, forming a potential "spring" structure near the ₹1,200 zone.
Resistance & Targets:
Immediate Resistance: ₹1,372 (Intermediate Horizontal Resistance Band).
Primary Target: ₹1,469 (Upper Resistance Zone / Measured Move Target).
Fundamental Drivers
Energy & Petrochemicals: Stable refining margins and expansion into green energy initiatives (solar, hydrogen, and gigafactories) provide long-term balance sheet stability.
Consumer Businesses (Retail & Telecom): Steady ARPU growth in Jio Platforms alongside consistent revenue expansion in Reliance Retail continue to drive core earnings growth.
Balance Sheet Flexibility: Strong institutional capital access and investment grade ratings maintain defensive strength despite broader market volatility.
Trading Idea Summary
Current Price: ₹1,244.00
Accumulation Zone: ₹1,210 – ₹1,240
Stop Loss: Below ₹1,195 (daily candle close)
Target 1: ₹1,372.40
Target 2: ₹1,469.50
Risk-to-Reward: 1:3.5+
Disclaimer
This post is for educational and informational purposes only and does not constitute financial or investment advice. Technical chart patterns and fundamental data are subject to market risks. Please perform your own research or consult a certified financial advisor before making any trading decisions.
Pattern Formation: The 1-Day chart of Reliance Industries Limited (RELIANCE) displays a multi-month Falling Wedge pattern. Lower highs and lower lows are gradually narrowing toward a technical apex, indicating seller exhaustion.
Support Zone: Price action is testing a major Strong Support Area around ₹1,200 – ₹1,210. This zone aligns with past macro swing lows and includes a recorded False Breakout / Liquidity Sweep (under ₹1,200), signaling strong institutional buying defense.
Accumulation / Spring: The chart highlights a rounded accumulation curve (green shade) emerging from the lower trendline of the wedge, forming a potential "spring" structure near the ₹1,200 zone.
Resistance & Targets:
Immediate Resistance: ₹1,372 (Intermediate Horizontal Resistance Band).
Primary Target: ₹1,469 (Upper Resistance Zone / Measured Move Target).
Fundamental Drivers
Energy & Petrochemicals: Stable refining margins and expansion into green energy initiatives (solar, hydrogen, and gigafactories) provide long-term balance sheet stability.
Consumer Businesses (Retail & Telecom): Steady ARPU growth in Jio Platforms alongside consistent revenue expansion in Reliance Retail continue to drive core earnings growth.
Balance Sheet Flexibility: Strong institutional capital access and investment grade ratings maintain defensive strength despite broader market volatility.
Trading Idea Summary
Current Price: ₹1,244.00
Accumulation Zone: ₹1,210 – ₹1,240
Stop Loss: Below ₹1,195 (daily candle close)
Target 1: ₹1,372.40
Target 2: ₹1,469.50
Risk-to-Reward: 1:3.5+
Disclaimer
This post is for educational and informational purposes only and does not constitute financial or investment advice. Technical chart patterns and fundamental data are subject to market risks. Please perform your own research or consult a certified financial advisor before making any trading decisions.

Penafian
Maklumat dan penerbitan adalah tidak bertujuan, dan tidak membentuk, nasihat atau cadangan kewangan, pelaburan, dagangan atau jenis lain yang diberikan atau disahkan oleh TradingView. Baca lebih dalam Terma Penggunaan.
Penafian
Maklumat dan penerbitan adalah tidak bertujuan, dan tidak membentuk, nasihat atau cadangan kewangan, pelaburan, dagangan atau jenis lain yang diberikan atau disahkan oleh TradingView. Baca lebih dalam Terma Penggunaan.