
Experimental analysis with the intention to follow back later on as I am still learning
I thought I'd share this as it seems interesting, given its low probability.
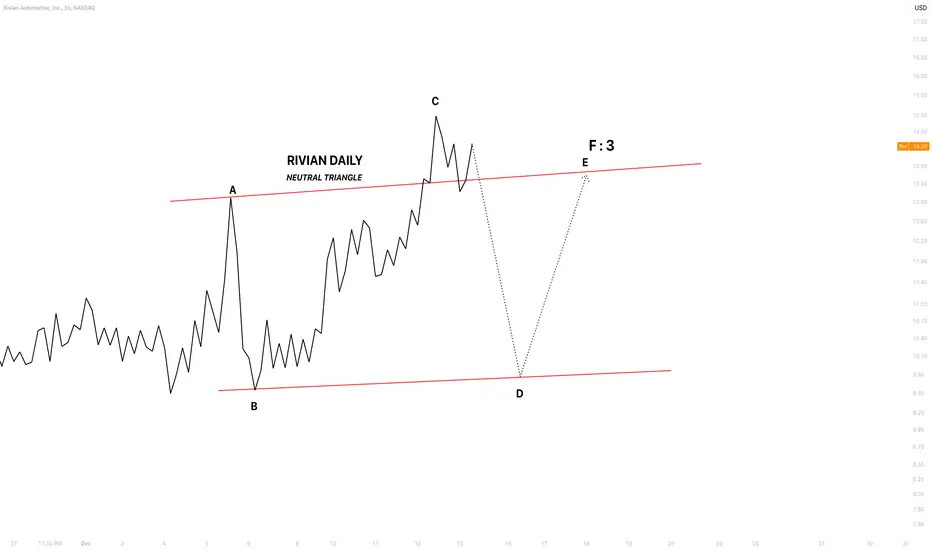
The lines represent a projected path and do not represent time
The pattern forms a neutral triangle.
Wave C is the largest, potentially 138% to 161.8% of wave A.
In this scenario, wave C concludes at 138%, provided my calculations are correct.
Any movement above wave C would invalidate this pattern.
I anticipate a significant sell-off to begin shortly for this to be accurate.
Let's see how this goes
I thought I'd share this as it seems interesting, given its low probability.
The lines represent a projected path and do not represent time
The pattern forms a neutral triangle.
Wave C is the largest, potentially 138% to 161.8% of wave A.
In this scenario, wave C concludes at 138%, provided my calculations are correct.
Any movement above wave C would invalidate this pattern.
I anticipate a significant sell-off to begin shortly for this to be accurate.
Let's see how this goes
Nota
It appears that the rally has concluded and wave C has come to an end.
Penafian
Maklumat dan penerbitan adalah tidak bertujuan, dan tidak membentuk, nasihat atau cadangan kewangan, pelaburan, dagangan atau jenis lain yang diberikan atau disahkan oleh TradingView. Baca lebih dalam Terma Penggunaan.
Penafian
Maklumat dan penerbitan adalah tidak bertujuan, dan tidak membentuk, nasihat atau cadangan kewangan, pelaburan, dagangan atau jenis lain yang diberikan atau disahkan oleh TradingView. Baca lebih dalam Terma Penggunaan.