
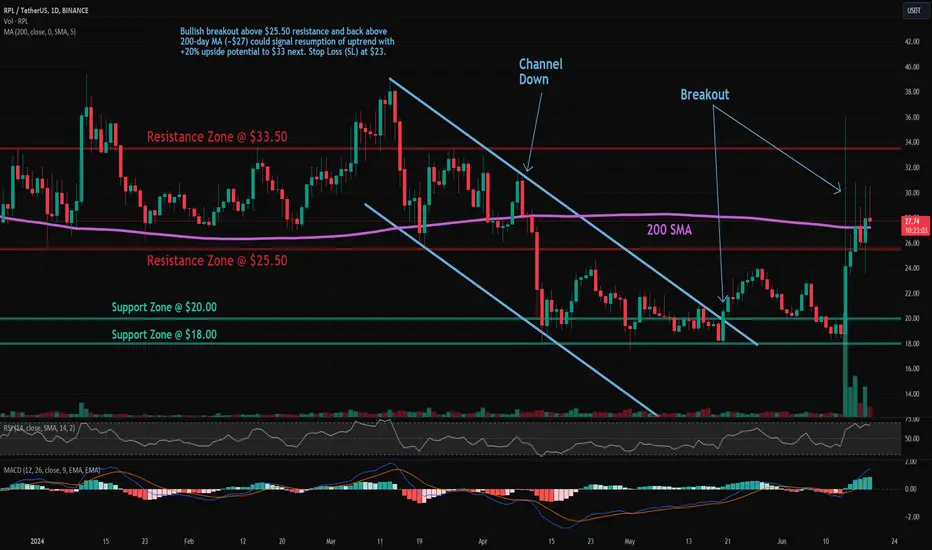
Trade setup: Bullish breakout above $25.50 resistance and back above 200-day MA (~$27) could signal resumption of uptrend with +20% upside potential to $33 next. Stop Loss (SL) at $23.
Pattern: Resistance Breakout. Once a price breaks above a resistance zone, it signals that buyers have absorbed all the supply from sellers at this level and price can resume it's advance. Following a resistance breakout, the next closest resistance zone becomes a price target. Learn to trade key level breakouts in Lesson 7.
Trend: Short-term trend is Strong Up, Medium-term trend is Neutral and Long-term trend is Strong Down.
Momentum: Price is neither overbought nor oversold currently, based on RSI-14 levels (RSI > 30 and RSI < 70).
Support and Resistance: Nearest Support Zone is $20.00, then $18.00. Nearest Resistance Zone is $33.50, then $39.00.
Pattern: Resistance Breakout. Once a price breaks above a resistance zone, it signals that buyers have absorbed all the supply from sellers at this level and price can resume it's advance. Following a resistance breakout, the next closest resistance zone becomes a price target. Learn to trade key level breakouts in Lesson 7.
Trend: Short-term trend is Strong Up, Medium-term trend is Neutral and Long-term trend is Strong Down.
Momentum: Price is neither overbought nor oversold currently, based on RSI-14 levels (RSI > 30 and RSI < 70).
Support and Resistance: Nearest Support Zone is $20.00, then $18.00. Nearest Resistance Zone is $33.50, then $39.00.

Penafian
Maklumat dan penerbitan adalah tidak bertujuan, dan tidak membentuk, nasihat atau cadangan kewangan, pelaburan, dagangan atau jenis lain yang diberikan atau disahkan oleh TradingView. Baca lebih dalam Terma Penggunaan.
Penafian
Maklumat dan penerbitan adalah tidak bertujuan, dan tidak membentuk, nasihat atau cadangan kewangan, pelaburan, dagangan atau jenis lain yang diberikan atau disahkan oleh TradingView. Baca lebih dalam Terma Penggunaan.