
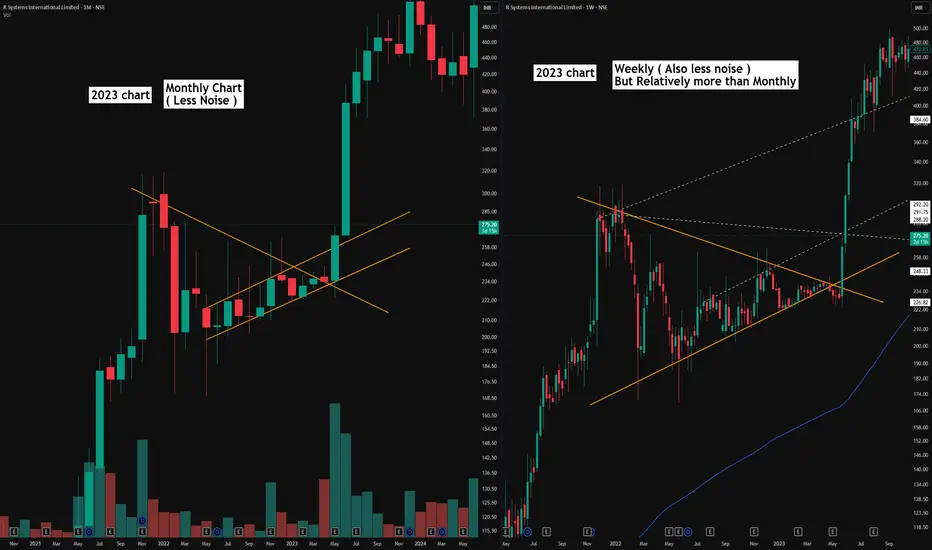
Historical 2023 chart shared strictly for educational purposes to explain multi-timeframe technical analysis. No current market view or recommendation is being expressed.
Sometimes the problem isn't the chart.
It’s the timeframe you're trying to read it on.
This historical 2023 example shows the same market structure from two different perspectives.. Weekly vs Monthly.
On the Weekly chart, there is naturally more information. More candles create more visible swings, potential support/resistance levels, trendlines and smaller structures. If we try to interpret every single one, the chart can quickly become cluttered.
Now move just one timeframe higher.
On the Monthly chart, much of that noise disappears and the larger structure becomes easier to read.
What looked complicated on the Weekly can be simplified into a cleaner symmetrical triangle, while another overlapping structure can also be interpreted as a parallel/rising channel.
Then comes something even simpler: a strong Marubozu-style monthly candle, with the May 2023 close providing a much cleaner view of the structural break than many of the smaller fluctuations visible on the Weekly chart.
That doesn't mean higher timeframe = better, or that lower timeframes should be ignored.
The lesson is flexibility.
If your chart suddenly has five support levels, four resistances, multiple patterns and trendlines everywhere.....
Sometimes you simply need to change perspective.
Hourly to Daily Shift
Daily to Weekly Shift and
Weekly to Monthly
More candles → Fewer candles
More noise → Simpler context
Then, once the larger picture is understood, lower timeframes can still be used to study the finer details.
Trading shouldn't become a competition to draw the most lines.
Use multiple timeframes. Stay flexible. Find the perspective where the structure makes sense to you.
Sometimes the problem isn't the chart.
It’s the timeframe you're trying to read it on.
This historical 2023 example shows the same market structure from two different perspectives.. Weekly vs Monthly.
On the Weekly chart, there is naturally more information. More candles create more visible swings, potential support/resistance levels, trendlines and smaller structures. If we try to interpret every single one, the chart can quickly become cluttered.
Now move just one timeframe higher.
On the Monthly chart, much of that noise disappears and the larger structure becomes easier to read.
What looked complicated on the Weekly can be simplified into a cleaner symmetrical triangle, while another overlapping structure can also be interpreted as a parallel/rising channel.
Then comes something even simpler: a strong Marubozu-style monthly candle, with the May 2023 close providing a much cleaner view of the structural break than many of the smaller fluctuations visible on the Weekly chart.
That doesn't mean higher timeframe = better, or that lower timeframes should be ignored.
The lesson is flexibility.
If your chart suddenly has five support levels, four resistances, multiple patterns and trendlines everywhere.....
Sometimes you simply need to change perspective.
Hourly to Daily Shift
Daily to Weekly Shift and
Weekly to Monthly
More candles → Fewer candles
More noise → Simpler context
Then, once the larger picture is understood, lower timeframes can still be used to study the finer details.
Trading shouldn't become a competition to draw the most lines.
Use multiple timeframes. Stay flexible. Find the perspective where the structure makes sense to you.

📊Swing & positional research with Buy, Sell & Hold recommendations
Contact for NOVEMBER SLOTS
📞WhatsApp ( Pro ): wa.me/919455664601
📢Free Picks on Telegram ( Join ) : t.me/hashtaghammer
Apoorv Dubey|SEBI RA INH000030287
Contact for NOVEMBER SLOTS
📞WhatsApp ( Pro ): wa.me/919455664601
📢Free Picks on Telegram ( Join ) : t.me/hashtaghammer
Apoorv Dubey|SEBI RA INH000030287
Penerbitan berkaitan
Penafian
Maklumat dan penerbitan adalah tidak bertujuan, dan tidak membentuk, nasihat atau cadangan kewangan, pelaburan, dagangan atau jenis lain yang diberikan atau disahkan oleh TradingView. Baca lebih dalam Terma Penggunaan.
📊Swing & positional research with Buy, Sell & Hold recommendations
Contact for NOVEMBER SLOTS
📞WhatsApp ( Pro ): wa.me/919455664601
📢Free Picks on Telegram ( Join ) : t.me/hashtaghammer
Apoorv Dubey|SEBI RA INH000030287
Contact for NOVEMBER SLOTS
📞WhatsApp ( Pro ): wa.me/919455664601
📢Free Picks on Telegram ( Join ) : t.me/hashtaghammer
Apoorv Dubey|SEBI RA INH000030287
Penerbitan berkaitan
Penafian
Maklumat dan penerbitan adalah tidak bertujuan, dan tidak membentuk, nasihat atau cadangan kewangan, pelaburan, dagangan atau jenis lain yang diberikan atau disahkan oleh TradingView. Baca lebih dalam Terma Penggunaan.