
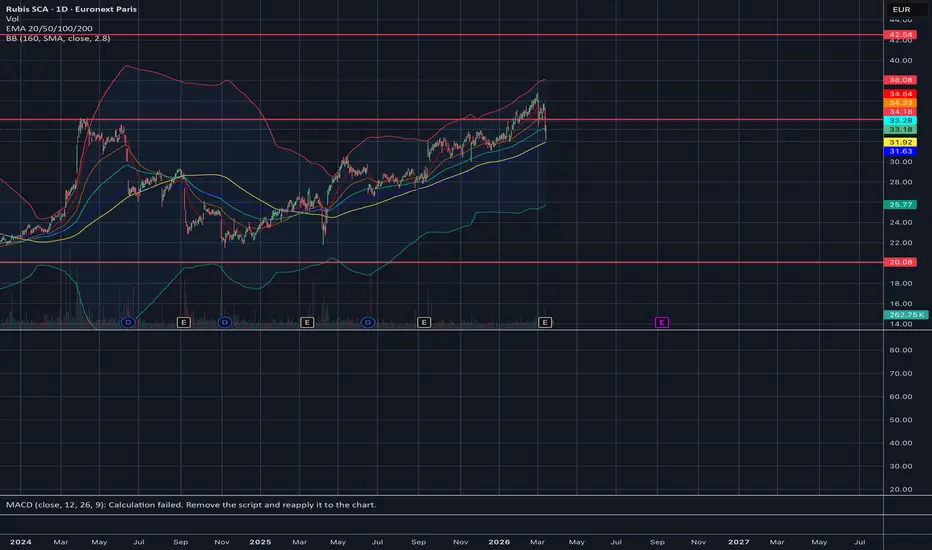
$RUBIS — Rubis SCA
Rubis has staged a significant recovery from the €20 floor, benefiting from a supportive oil price environment. However, the steady but uninspiring dividend growth trajectory raises questions about the company's ability to accelerate value creation beyond its current pace. This warrants caution despite the favorable macro tailwind.
Technical outlook:
Weekly EMAs are opening up, suggesting building momentum on the higher timeframe. Conversely, daily EMAs remain tightly compressed, reflecting indecision and a potential inflection point. Price has now reached the daily EMA 200, a critical juncture that will likely define the next directional move.
Scenario 1 (Bullish): Price bounces off the EMA 200, reclaims upward momentum, and breaks through the €34 resistance level. A confirmed breakout with €34 flipping to support would invalidate the bearish thesis and open room for further upside.
Scenario 2 (Bearish, favored): Price fails to hold the EMA 200, triggering a breakdown and renewed selling pressure. This would confirm distribution and likely accelerate downside.
Current position: Selling at €31.44
Bias: Bearish leaning. The technical setup at the EMA 200 is a make or break level, and the lack of strong fundamental catalysts tilts probability toward Scenario 2.
Key levels:
- Support: EMA 200 (dynamic)
- Resistance: €34

Penafian
Maklumat dan penerbitan adalah tidak bertujuan, dan tidak membentuk, nasihat atau cadangan kewangan, pelaburan, dagangan atau jenis lain yang diberikan atau disahkan oleh TradingView. Baca lebih dalam Terma Penggunaan.
Penafian
Maklumat dan penerbitan adalah tidak bertujuan, dan tidak membentuk, nasihat atau cadangan kewangan, pelaburan, dagangan atau jenis lain yang diberikan atau disahkan oleh TradingView. Baca lebih dalam Terma Penggunaan.