
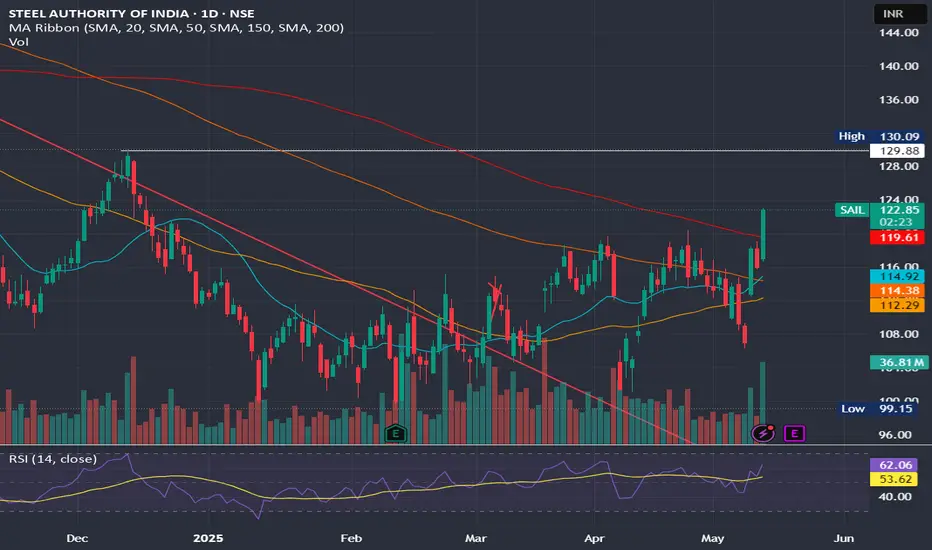
Here's a quick analysis of SAIL (Steel Authority of India Ltd.) stock:
Technical Overview
- Current Price: ₹122.61 INR
- Market Cap: ₹479.14 billion
- P/E Ratio: 22.56 (Moderate valuation)
- Dividend Yield: 1.72% (Stable returns)
- 52-Week Range: ₹99.15 - ₹175.35
Recent Trends
- The stock has been in a downtrend but is showing signs of reversal.
- Key Support Levels: ₹112.40 - ₹118.45.
- Breakout Potential: Analysts suggest a possible bullish trend with a 25% upside target.
Breakout Signals
- Double Rectangle & Falling Wedge Pattern: These formations indicate buyer dominance and a possible bullish trend.
- Key Resistance Level: ₹134 INR—recent trading action suggests a strong push above this level.
- Volume Surge: A 5% price increase with high trading volumes supports the breakout possibility.
Fundamental Insights
- Revenue & Profit: Recent results show degrowth in revenue and operating profit margins.
- Institutional Interest: FIIs (Foreign Institutional Investors) have been increasing their shareholding, which could indicate long-term confidence.
Investment Outlook
- Strengths: Strong institutional backing, potential trend reversal.
- Weaknesses: Near 52-week low, declining revenue.
- Opportunities: If the breakout holds, short-term gains could be significant.
- Threats: Market volatility, global steel demand fluctuations.🚀
Technical Overview
- Current Price: ₹122.61 INR
- Market Cap: ₹479.14 billion
- P/E Ratio: 22.56 (Moderate valuation)
- Dividend Yield: 1.72% (Stable returns)
- 52-Week Range: ₹99.15 - ₹175.35
Recent Trends
- The stock has been in a downtrend but is showing signs of reversal.
- Key Support Levels: ₹112.40 - ₹118.45.
- Breakout Potential: Analysts suggest a possible bullish trend with a 25% upside target.
Breakout Signals
- Double Rectangle & Falling Wedge Pattern: These formations indicate buyer dominance and a possible bullish trend.
- Key Resistance Level: ₹134 INR—recent trading action suggests a strong push above this level.
- Volume Surge: A 5% price increase with high trading volumes supports the breakout possibility.
Fundamental Insights
- Revenue & Profit: Recent results show degrowth in revenue and operating profit margins.
- Institutional Interest: FIIs (Foreign Institutional Investors) have been increasing their shareholding, which could indicate long-term confidence.
Investment Outlook
- Strengths: Strong institutional backing, potential trend reversal.
- Weaknesses: Near 52-week low, declining revenue.
- Opportunities: If the breakout holds, short-term gains could be significant.
- Threats: Market volatility, global steel demand fluctuations.🚀

Penafian
Maklumat dan penerbitan adalah tidak bertujuan, dan tidak membentuk, nasihat atau cadangan kewangan, pelaburan, dagangan atau jenis lain yang diberikan atau disahkan oleh TradingView. Baca lebih dalam Terma Penggunaan.
Penafian
Maklumat dan penerbitan adalah tidak bertujuan, dan tidak membentuk, nasihat atau cadangan kewangan, pelaburan, dagangan atau jenis lain yang diberikan atau disahkan oleh TradingView. Baca lebih dalam Terma Penggunaan.