
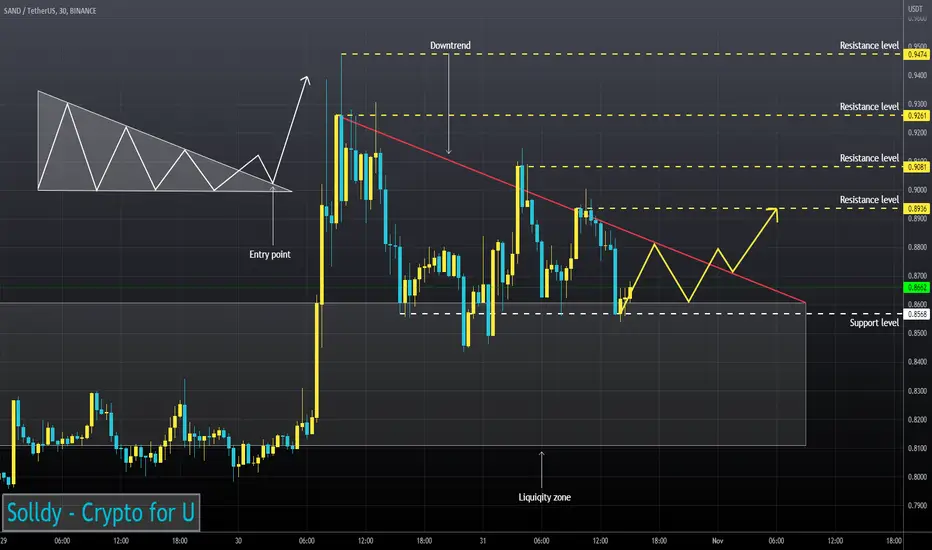
Trading volumes don't show sellers' interest in further price decrease.
SAND continues to move above the liquidity zone.
RSI continues to move in the Buy zone (4H TF) and at 30m Timeframe the RSI chart is testing the support level.
Price is testing 50EMA as support (1H TF)
I think the asset may bounce after it fixes above the downtrend line.
SAND continues to move above the liquidity zone.
RSI continues to move in the Buy zone (4H TF) and at 30m Timeframe the RSI chart is testing the support level.
Price is testing 50EMA as support (1H TF)
I think the asset may bounce after it fixes above the downtrend line.

Penerbitan berkaitan
Penafian
Maklumat dan penerbitan adalah tidak bertujuan, dan tidak membentuk, nasihat atau cadangan kewangan, pelaburan, dagangan atau jenis lain yang diberikan atau disahkan oleh TradingView. Baca lebih dalam Terma Penggunaan.
Penerbitan berkaitan
Penafian
Maklumat dan penerbitan adalah tidak bertujuan, dan tidak membentuk, nasihat atau cadangan kewangan, pelaburan, dagangan atau jenis lain yang diberikan atau disahkan oleh TradingView. Baca lebih dalam Terma Penggunaan.