
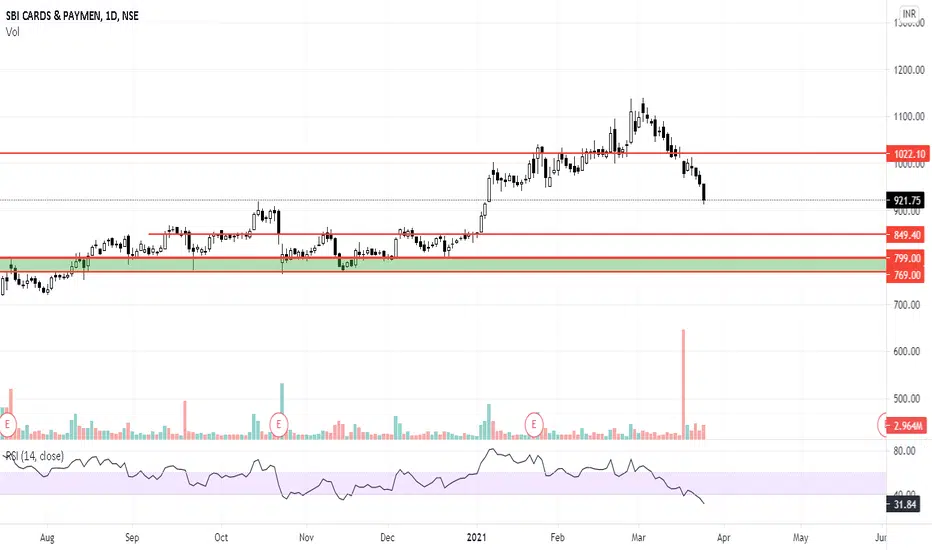
SBICARD has seen a remarkable rally from 500 levels to 1100 levels in the past 1 year.
Currently, we are seeing some correction in the stock.
The monthly and weekly structure is still positive, though it looks weak on the daily chart and the current price action also indicates that this correction can extend a little more.
Important support that Weekly and daily chart gives around 850 levels.
And the major support levels come around 799 - 670, which you can say lifeline support.
So keep an eye on the stock and grab the opportunity when stock presents it to you.
Trade/Invest at your own risk.
Currently, we are seeing some correction in the stock.
The monthly and weekly structure is still positive, though it looks weak on the daily chart and the current price action also indicates that this correction can extend a little more.
Important support that Weekly and daily chart gives around 850 levels.
And the major support levels come around 799 - 670, which you can say lifeline support.
So keep an eye on the stock and grab the opportunity when stock presents it to you.
Trade/Invest at your own risk.

Penerbitan berkaitan
Penafian
Maklumat dan penerbitan adalah tidak bertujuan, dan tidak membentuk, nasihat atau cadangan kewangan, pelaburan, dagangan atau jenis lain yang diberikan atau disahkan oleh TradingView. Baca lebih dalam Terma Penggunaan.
Penerbitan berkaitan
Penafian
Maklumat dan penerbitan adalah tidak bertujuan, dan tidak membentuk, nasihat atau cadangan kewangan, pelaburan, dagangan atau jenis lain yang diberikan atau disahkan oleh TradingView. Baca lebih dalam Terma Penggunaan.