
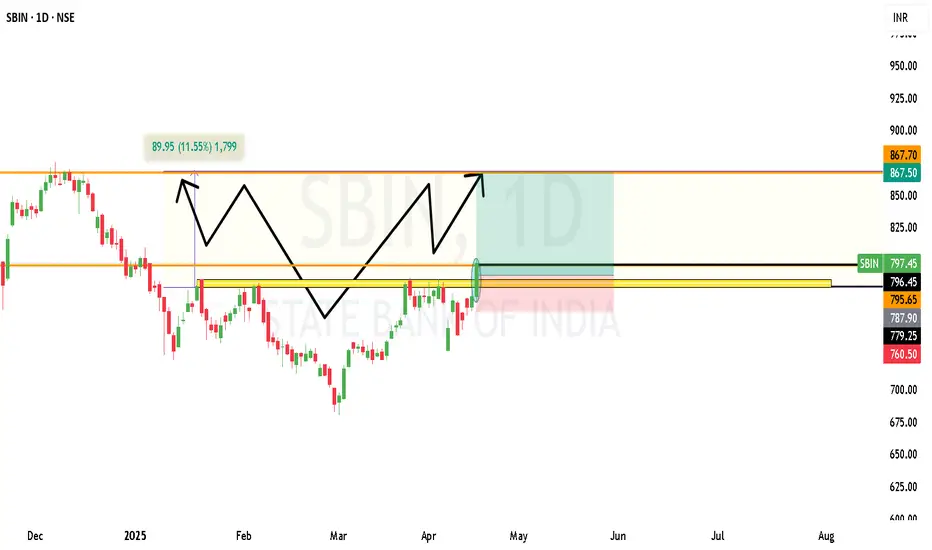
Exciting pattern on SBIN(State Bank Of India) chart!
Validation of my target:
1. Inverted Head & Shoulder pattern confirmed on daily chart.
2. Neckline breakout already happened @ 822
3. Target Calculation: Neckline + (Neckline - head low)
Approx. 874,
4. Technical Indicator also supportive
*RSI trending up from oversold zone
* MACD crossover happened recently.
Target will range between 10 points 864 to 874.
Risk to reward is 1:3
Stop Loss previous low 760
For Educational purpose only

Penafian
Maklumat dan penerbitan adalah tidak bertujuan, dan tidak membentuk, nasihat atau cadangan kewangan, pelaburan, dagangan atau jenis lain yang diberikan atau disahkan oleh TradingView. Baca lebih dalam Terma Penggunaan.
Penafian
Maklumat dan penerbitan adalah tidak bertujuan, dan tidak membentuk, nasihat atau cadangan kewangan, pelaburan, dagangan atau jenis lain yang diberikan atau disahkan oleh TradingView. Baca lebih dalam Terma Penggunaan.