
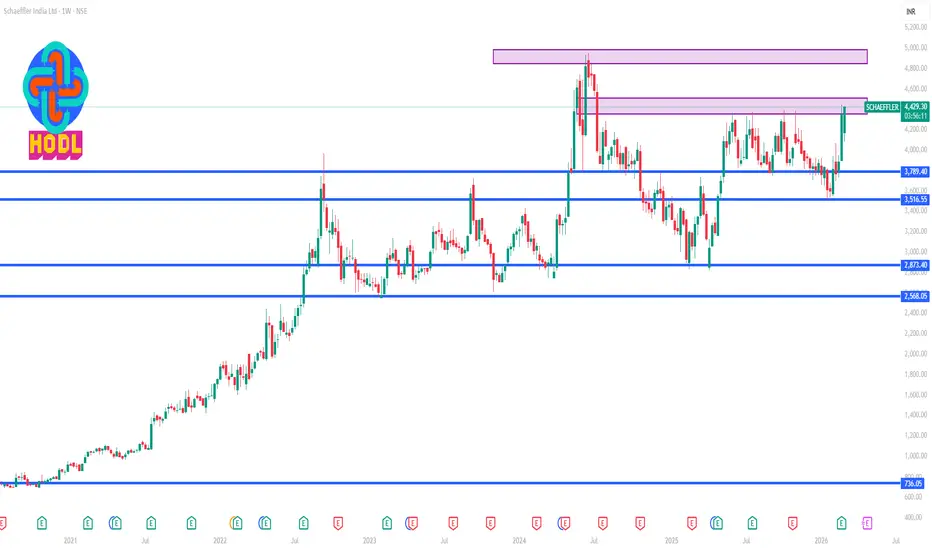
Current price: around ₹4,400– ₹4,420on NSE recently (March 2026 range).
📊 Weekly Time Frame Levels (Technical View)
🔹 Weekly Pivot
Pivot: ₹4,234
🔼 Weekly Resistance
R1: ₹4,566
R2: ₹4,776
R3: ₹5,108
🔽 Weekly Support
S1: ₹4,024
S2: ₹3,692
S3: ₹3,482
These pivot-based levels are calculated from previous week price action and used by traders to estimate possible breakout or reversal zones.
📈 Key Demand & Supply Zones (Weekly)
Strong Support Zone
₹4,000 – ₹4,020
₹3,690 – ₹3,720
Strong Resistance Zone
₹4,560 – ₹4,600
₹4,770 – ₹4,800
📉 Technical Indicators (Current)
RSI: ~55–60 → Neutral to bullish momentum
MACD: Buy signal
Moving averages: Mostly bullish alignment
This suggests the stock still has positive momentum on higher time frames.
🎯 Weekly Trading Scenarios
🟢 Bullish Scenario
If price sustains above ₹4,250–₹4,300
Target: ₹4,560 → ₹4,770
🟡 Sideways Scenario
Range likely:
₹4,000 – ₹4,500
🔴 Bearish Scenario
If ₹4,000 breaks
Next downside: ₹3,700 – ₹3,690
✅ Most important weekly levels
Breakout level: ₹4,300
Major resistance: ₹4,560
Major support: ₹4,000

Contact Knowledgehub for a detailed consultation: Dm on WhatsApp: [wa.link/a2o0kz]-
Phone No: [+91 93102 26243]-
Email: [tradingviewknowledgehub@gmail.com]---
-- Let’s achieve success together!
Phone No: [+91 93102 26243]-
Email: [tradingviewknowledgehub@gmail.com]---
-- Let’s achieve success together!
Penerbitan berkaitan
Penafian
Maklumat dan penerbitan adalah tidak bertujuan, dan tidak membentuk, nasihat atau cadangan kewangan, pelaburan, dagangan atau jenis lain yang diberikan atau disahkan oleh TradingView. Baca lebih dalam Terma Penggunaan.