
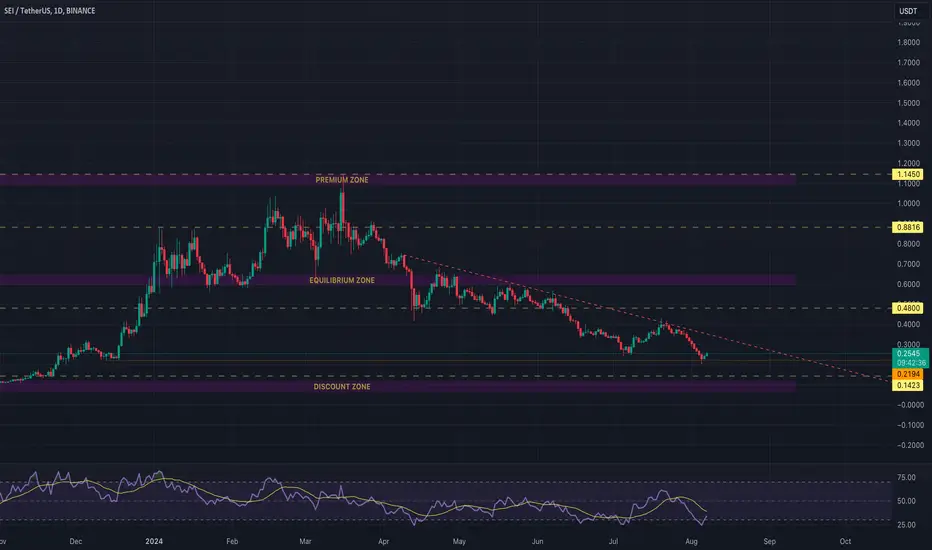
 SEI 1D chart;
From April 9th to the present day, it continues to decline below the falling trend line.
The support zone (orange line) just below the current level seems to have worked in the last decline.
If it is crossed, there is a support line below it (yellow) and then the Discount area.
We can say that the direction of the movement will be completely shaped by Bitcoin's stance in the market, as no structure is visible for now until the contraction.

For more you can follow me on X. @UgurTash
Penafian
Maklumat dan penerbitan adalah tidak bertujuan, dan tidak membentuk, nasihat atau cadangan kewangan, pelaburan, dagangan atau jenis lain yang diberikan atau disahkan oleh TradingView. Baca lebih dalam Terma Penggunaan.
For more you can follow me on X. @UgurTash
Penafian
Maklumat dan penerbitan adalah tidak bertujuan, dan tidak membentuk, nasihat atau cadangan kewangan, pelaburan, dagangan atau jenis lain yang diberikan atau disahkan oleh TradingView. Baca lebih dalam Terma Penggunaan.