
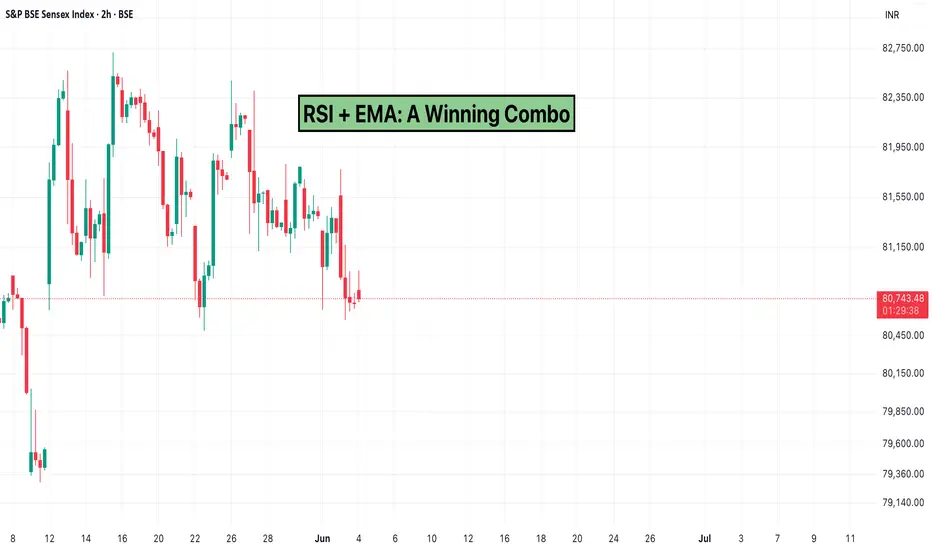
When it comes to identifying strong trading setups, combining indicators can offer a more complete picture of market behavior.
One popular and effective combination used by traders on platforms like TradingView is the Relative Strength Index (RSI) and the Exponential Moving Average (EMA).
Together, these tools balance momentum with trend-following signals, helping you make more confident trading decisions.
What is RSI?
The Relative Strength Index (RSI) is a momentum oscillator that measures the speed and change of price movements. It ranges from 0 to 100 and is commonly used to identify overbought and oversold conditions:
What is EMA?
The Exponential Moving Average (EMA) is a type of moving average that places greater weight on recent price data. This makes it more responsive to recent market moves compared to a Simple Moving Average (SMA).
Why Combine RSI and EMA?
By blending RSI and EMA, traders can filter trades more effectively:
Example Setup
This method helps align your trades with the broader trend while timing your entries based on momentum shifts.
Using It on TradingView
Conclusion
RSI and EMA complement each other well, offering a blend of trend detection and momentum timing. This combo is simple yet effective for traders of all levels.
As always, it’s best to test the setup across different assets and timeframes to find what works best for you.
One popular and effective combination used by traders on platforms like TradingView is the Relative Strength Index (RSI) and the Exponential Moving Average (EMA).
Together, these tools balance momentum with trend-following signals, helping you make more confident trading decisions.
What is RSI?
The Relative Strength Index (RSI) is a momentum oscillator that measures the speed and change of price movements. It ranges from 0 to 100 and is commonly used to identify overbought and oversold conditions:
- RSI above 70 often signals overbought conditions.
- RSI below 30 suggests the asset may be oversold.
- It’s useful for spotting potential reversals or confirming trend strength.
What is EMA?
The Exponential Moving Average (EMA) is a type of moving average that places greater weight on recent price data. This makes it more responsive to recent market moves compared to a Simple Moving Average (SMA).
- Short EMAs (e.g., 9 or 21) react quickly and are helpful for identifying short-term trends.
- Longer EMAs (e.g., 50 or 200) show broader trend direction.
- EMA crossovers can generate entry or exit signals.
Why Combine RSI and EMA?
By blending RSI and EMA, traders can filter trades more effectively:
- Trend Confirmation with EMA: Use EMA to determine the overall trend direction.
- Entry/Exit Timing with RSI: Use RSI to time entries during pullbacks or identify momentum exhaustion.
- Avoid False Signals: EMA helps validate RSI signals, reducing the chance of getting caught in choppy market conditions.
Example Setup
- Use a 50-period EMA to define the trend.
- In an uptrend (price above EMA), look for RSI to dip near 30–40 before considering long entries.
- In a downtrend (price below EMA), look for RSI to rise near 60–70 before considering short entries.
This method helps align your trades with the broader trend while timing your entries based on momentum shifts.
Using It on TradingView
- Add the EMA indicator and set your desired period (e.g., 50).
- Add the RSI indicator and leave the default settings (14-period, 70/30 levels).
- Use both indicators in combination to plan your entries, exits, or avoid overtrading.
Conclusion
RSI and EMA complement each other well, offering a blend of trend detection and momentum timing. This combo is simple yet effective for traders of all levels.
As always, it’s best to test the setup across different assets and timeframes to find what works best for you.

Elevate your Trading Experience 🚀
📱 Download Dhan App on iOS and Android and Start Trading.
📱 Download Dhan App on iOS and Android and Start Trading.
Penafian
Maklumat dan penerbitan adalah tidak bertujuan, dan tidak membentuk, nasihat atau cadangan kewangan, pelaburan, dagangan atau jenis lain yang diberikan atau disahkan oleh TradingView. Baca lebih dalam Terma Penggunaan.
Penafian
Maklumat dan penerbitan adalah tidak bertujuan, dan tidak membentuk, nasihat atau cadangan kewangan, pelaburan, dagangan atau jenis lain yang diberikan atau disahkan oleh TradingView. Baca lebih dalam Terma Penggunaan.