
📊 SIEMENS – Technical & Educational Snapshot
Ticker: NSE: SIEMENS
Sector: ⚡ Industrial Engineering & Capital Goods
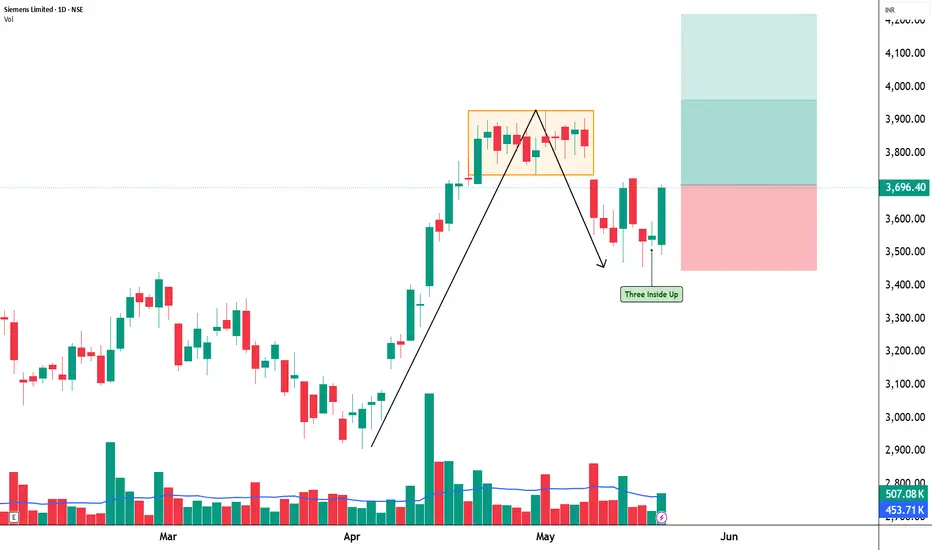
CMP: 3,696.40 ▲ (+4.10% | 20 May 2026)
Learning Rating: ⭐⭐⭐⭐☆ (Recovery Structure Near Supply Zone)
Chart Pattern Observed: 📈 Pullback Stabilisation + Recovery Bounce
Candlestick Pattern Observed: Three Inside Up
📊 Technical Snapshot
SIEMENS is attempting a structured recovery after facing corrective pressure from higher resistance zones. Price has started stabilising above near-term support levels, while the latest bullish candle indicates renewed buying participation after short-term weakness. The “Three Inside Up” formation reflects improving sentiment and suggests that bearish momentum may be slowing gradually. RSI is currently near 54.6, showing recovery from neutral territory without entering overbought conditions yet. MACD remains mildly negative but flattening, indicating that downside momentum is cooling while price attempts to rebuild structure. Bollinger Bands are compressing slightly after volatility expansion, often observed before the next directional move. Sustained acceptance above nearby resistance levels could improve continuation probability in the coming sessions.
📊 Volume Analysis
🔹 Current Volume: ~507K
🔹 Average Volume (20-period): ~453K ✅
📈 Volume is slightly above average, reflecting improving participation during recovery.
💡 Interpretation: Moderate improvement in participation suggests early buying interest, though stronger continuation confirmation may require sustained higher-volume expansion near resistance zones.
🔑 Key Levels – Daily Timeframe
Support Areas: 3558 | 3419 | 3346
Resistance Areas: 3769 | 3843 | 3981
These are zones where price has paused or reacted earlier.
📉 Pullback Zones (Chart-Based Observation)
Healthy Pullback Zone 1: 3630 – 3599
Healthy Pullback Zone 2: 3558 – 3419
Deep Pullback Support Zone: 3346 Area
💡 Pullbacks holding above support clusters may support trend continuation, while rejection near higher supply zones can temporarily slow momentum expansion.
What’s Catching Our Eye: Bullish recovery candle emerging after consolidation.
What to Watch For: Sustained price acceptance above the 3769 resistance zone.
Failure Zone: Sustained weakness below 3558 weakens recovery structure.
Risks to Watch: Supply pressure near upper resistance band.
What to Expect Next: Gradual recovery continuation with volatility expansion possible.
Bullish Case: Strong follow-through buying may support breakout continuation.
Bearish Case: Failure near resistance can trigger renewed range-bound action.
Momentum Case: Momentum improving gradually but still requires confirmation.
STWP Equity Snapshot – SIEMENS
Reference Setup:
Reference: 3,705
Invalidation Level: 3,447
Upside Reference 1: 3,962
Upside Reference 2: 4,219
STWP View:
• Sentiment: Recovery Bullish | Trend: Uptrend (Weakening)
• RSI: 54.66 (Neutral Recovery Zone)
• Volume: Above Average Participation
• Structure: Recovery Attempt Inside Broader Uptrend
Final Outlook
Momentum: Moderate
Trend: Recovery Uptrend
Risk: Moderate
Volume: Moderate
Learning Note: Recovery setups become stronger when bullish reversal structures are supported by improving participation near key resistance zones.
⚠️ Disclaimer:
This analysis is generated strictly for educational and analytical purposes only.
This does NOT constitute investment advice, trading advice, or a recommendation to buy or sell any security or derivative instrument.
Options trading involves substantial risk and may not be suitable for all participants.
Readers are advised to exercise independent judgment and consult a SEBI-registered financial advisor before taking any trading or investment decisions.
STWP assumes no responsibility for any financial loss arising from the use of this analysis.
💬 Recovery continuation or another range-bound pause — what does the structure suggest to you?
🔼 Boost | ✍️ Comment | 🔁 Share with a learner
👉 Follow STWP for clean chart-reading insights
🚀 Stay Calm. Stay Clean. Trade With Patience.
Ticker: NSE: SIEMENS
Sector: ⚡ Industrial Engineering & Capital Goods
CMP: 3,696.40 ▲ (+4.10% | 20 May 2026)
Learning Rating: ⭐⭐⭐⭐☆ (Recovery Structure Near Supply Zone)
Chart Pattern Observed: 📈 Pullback Stabilisation + Recovery Bounce
Candlestick Pattern Observed: Three Inside Up
📊 Technical Snapshot
SIEMENS is attempting a structured recovery after facing corrective pressure from higher resistance zones. Price has started stabilising above near-term support levels, while the latest bullish candle indicates renewed buying participation after short-term weakness. The “Three Inside Up” formation reflects improving sentiment and suggests that bearish momentum may be slowing gradually. RSI is currently near 54.6, showing recovery from neutral territory without entering overbought conditions yet. MACD remains mildly negative but flattening, indicating that downside momentum is cooling while price attempts to rebuild structure. Bollinger Bands are compressing slightly after volatility expansion, often observed before the next directional move. Sustained acceptance above nearby resistance levels could improve continuation probability in the coming sessions.
📊 Volume Analysis
🔹 Current Volume: ~507K
🔹 Average Volume (20-period): ~453K ✅
📈 Volume is slightly above average, reflecting improving participation during recovery.
💡 Interpretation: Moderate improvement in participation suggests early buying interest, though stronger continuation confirmation may require sustained higher-volume expansion near resistance zones.
🔑 Key Levels – Daily Timeframe
Support Areas: 3558 | 3419 | 3346
Resistance Areas: 3769 | 3843 | 3981
These are zones where price has paused or reacted earlier.
📉 Pullback Zones (Chart-Based Observation)
Healthy Pullback Zone 1: 3630 – 3599
Healthy Pullback Zone 2: 3558 – 3419
Deep Pullback Support Zone: 3346 Area
💡 Pullbacks holding above support clusters may support trend continuation, while rejection near higher supply zones can temporarily slow momentum expansion.
What’s Catching Our Eye: Bullish recovery candle emerging after consolidation.
What to Watch For: Sustained price acceptance above the 3769 resistance zone.
Failure Zone: Sustained weakness below 3558 weakens recovery structure.
Risks to Watch: Supply pressure near upper resistance band.
What to Expect Next: Gradual recovery continuation with volatility expansion possible.
Bullish Case: Strong follow-through buying may support breakout continuation.
Bearish Case: Failure near resistance can trigger renewed range-bound action.
Momentum Case: Momentum improving gradually but still requires confirmation.
STWP Equity Snapshot – SIEMENS
Reference Setup:
Reference: 3,705
Invalidation Level: 3,447
Upside Reference 1: 3,962
Upside Reference 2: 4,219
STWP View:
• Sentiment: Recovery Bullish | Trend: Uptrend (Weakening)
• RSI: 54.66 (Neutral Recovery Zone)
• Volume: Above Average Participation
• Structure: Recovery Attempt Inside Broader Uptrend
Final Outlook
Momentum: Moderate
Trend: Recovery Uptrend
Risk: Moderate
Volume: Moderate
Learning Note: Recovery setups become stronger when bullish reversal structures are supported by improving participation near key resistance zones.
⚠️ Disclaimer:
This analysis is generated strictly for educational and analytical purposes only.
This does NOT constitute investment advice, trading advice, or a recommendation to buy or sell any security or derivative instrument.
Options trading involves substantial risk and may not be suitable for all participants.
Readers are advised to exercise independent judgment and consult a SEBI-registered financial advisor before taking any trading or investment decisions.
STWP assumes no responsibility for any financial loss arising from the use of this analysis.
💬 Recovery continuation or another range-bound pause — what does the structure suggest to you?
🔼 Boost | ✍️ Comment | 🔁 Share with a learner
👉 Follow STWP for clean chart-reading insights
🚀 Stay Calm. Stay Clean. Trade With Patience.

STWP | Mentor & Demand-Supply Specialist |
Empowering traders through structured learning |
simpletradewithpatience.com
Community: chat.whatsapp.com/BEYz0tkqP0fJPBCWf59uel
wa.me/message/6IOPHGOXMGZ4N1
Educational Only
Empowering traders through structured learning |
simpletradewithpatience.com
Community: chat.whatsapp.com/BEYz0tkqP0fJPBCWf59uel
wa.me/message/6IOPHGOXMGZ4N1
Educational Only
Penafian
Maklumat dan penerbitan adalah tidak bertujuan, dan tidak membentuk, nasihat atau cadangan kewangan, pelaburan, dagangan atau jenis lain yang diberikan atau disahkan oleh TradingView. Baca lebih dalam Terma Penggunaan.
STWP | Mentor & Demand-Supply Specialist |
Empowering traders through structured learning |
simpletradewithpatience.com
Community: chat.whatsapp.com/BEYz0tkqP0fJPBCWf59uel
wa.me/message/6IOPHGOXMGZ4N1
Educational Only
Empowering traders through structured learning |
simpletradewithpatience.com
Community: chat.whatsapp.com/BEYz0tkqP0fJPBCWf59uel
wa.me/message/6IOPHGOXMGZ4N1
Educational Only
Penafian
Maklumat dan penerbitan adalah tidak bertujuan, dan tidak membentuk, nasihat atau cadangan kewangan, pelaburan, dagangan atau jenis lain yang diberikan atau disahkan oleh TradingView. Baca lebih dalam Terma Penggunaan.