
Possible Silver to $50 according to Point and Figure charts
**Bearish Silver? Hopefully not — but here’s the argument**
Where is the bottom before silver eventually makes its next major move higher?
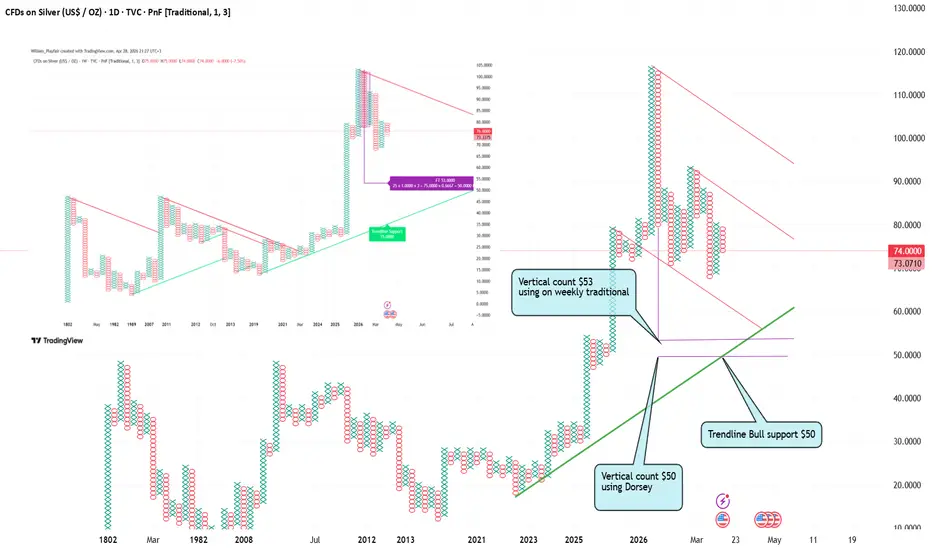
Looking at **Point & Figure vertical counts**, there is a slightly concerning possibility. You could argue for a cluster of downside targets around **$50**, which is lower than I previously expected.
Now, this needs to be taken with caution. You can always debate:
* whether the count is valid
* whether the column selection is correct
* or whether the methodology itself is appropriate
That said, with some time on hand, I revisited P&F analysis to see what it might suggest.
---
### **Background & Perspective**
I was trained by JDP and studied extensively under classic P&F methodologies — including work from Dorsey, Murphy, and John Brooks. In hindsight, I didn’t fully appreciate how fortunate I was to learn from people of that calibre.
---
### **Current Sentiment vs Risk**
Market sentiment for silver remains broadly bullish, and retail continues to accumulate on dips. From a contrarian standpoint, that’s something to be cautious about — ideally, we’d want to see sentiment weaken before a strong move higher.
There’s also the question of positioning. It has been widely discussed (especially online) that large institutions like JPM inherited significant short exposure between 2008–2025. If true, they may now be neutral or even long — but it’s difficult to verify.
---
### **Was Silver Suppressed?**
In my view, silver was effectively held down for years. It was the last major commodity to break out of its **~45-year range (1980–2025)**.
After breaking out around the low $40s, it surged aggressively toward ~$121, before retracing sharply to roughly half that level.
The key question now:
> Could price be pushed lower again before any sustained move higher?
---
### **The Bigger Picture (200-Year Chart)**
The long-term P&F chart (dating back to the 1800s) shows a remarkably clean **wedge structure** — something very rare over such a long time horizon.
Given that:
* A retest of the long-term **45° bullish trendline** is entirely possible
* That trendline currently aligns around the **$48–$50 zone**
* And if long-term targets are in the **$300–$1000+ range**, a pullback to the breakout zone is not unusual
From a macro perspective, this would simply be:
> Resistance (~$48) turning into support
---
### **Time vs Structure (Important P&F Concept)**
Remember:
P&F charts do **not measure time**, only price reversals.
So before the weekly trendline reaches that $48–$50 level, we could still see:
* 5–6 smaller alternating bull and bear legs
On the **daily chart**, price is already near that level, which gives some hope the bearish setup may fail and price could move higher sooner.
---
### **Macro Risks**
There are a few macro scenarios that could pressure silver:
**1. Oil + Recession Scenario**
* Rising oil prices could trigger recessionary pressure
* Central banks may need liquidity → sell gold
* This could widen the gold/silver ratio and drag silver lower
* Especially if countries need USD to service debt
**2. Dollar Demand via Energy**
* If oil must be purchased in USD
* Countries may need to:
* sell gold/silver
* or exchange assets for dollars
* This could create downward pressure on metals
---
### **Invalidation of Bearish Case**
The bearish setup is invalidated if:
* price closes strongly higher
* or makes a new ATH
In that case, the vertical count flips bullish, with a potential target in the **$224–$229 range**, depending on timing and structure.
---
### **Long-Term View**
Long term, silver still looks very attractive.
* ~$50 → strong accumulation zone
* $35–$37 → extreme opportunity (low probability ~5%)
That lower scenario could occur as a:
> sharp spike low designed to shake out holders and invalidate bullish setups
---
### **Manipulation Angle (Hypothetical)**
If silver has been manipulated in the past, then logically:
* it could be pushed lower again
* even to levels many believe are “impossible”
A drop into the $30s could:
* force capitulation
* flush out physical holders
* occur just before a major multi-year rally
---
### **Key Support Zones**
* **$20–$40 range** → massive historical volume → strong support
* **Low $60s** → attractive accumulation area
* even if broken, unlikely to stay below for long
---
### **Opportunity in Miners**
If silver pulls back:
* silver miners could offer a major opportunity
* previous cycles showed strong outperformance
If price resets:
> the miner trade could potentially be repeated
---
### **Timeframe Approach**
You should look at:
* Daily
* Weekly
* Monthly
Then ask:
> Which chart structure looks the cleanest and most logical?
For me, the **weekly chart** stands out.
* Conservative close-based analysis suggests ~$53
* Other timeframes produce different targets
* A **360° view** is best
---
### **Why Weekly Matters**
Weekly charts:
* reduce noise
* reduce short-term manipulation
* are harder to control than intraday pricing
Holding price below weekly closes consistently is difficult.
---
### **Final Thoughts**
Technical analysis — especially classic P&F — is underrated today. The older generation of analysts were incredibly skilled, and there’s still a lot to learn from them.
If silver continues higher:
* and gold pushes toward extreme levels (e.g. $20k scenario)
* silver could enter a completely different phase
Along the way:
* multiple vertical & horizontal counts will form
* ideally clustering around major targets
---
### **Bottom Line**
* Worst-case scenario: pullback toward $50 (or lower spike $35)
* Best-case scenario: major long-term breakout
If you can manage the downside risk:
> the long-term upside case for silver remains very strong
Cheeky orders in place? just in case it goes that low?
Where is the bottom before silver eventually makes its next major move higher?
Looking at **Point & Figure vertical counts**, there is a slightly concerning possibility. You could argue for a cluster of downside targets around **$50**, which is lower than I previously expected.
Now, this needs to be taken with caution. You can always debate:
* whether the count is valid
* whether the column selection is correct
* or whether the methodology itself is appropriate
That said, with some time on hand, I revisited P&F analysis to see what it might suggest.
---
### **Background & Perspective**
I was trained by JDP and studied extensively under classic P&F methodologies — including work from Dorsey, Murphy, and John Brooks. In hindsight, I didn’t fully appreciate how fortunate I was to learn from people of that calibre.
---
### **Current Sentiment vs Risk**
Market sentiment for silver remains broadly bullish, and retail continues to accumulate on dips. From a contrarian standpoint, that’s something to be cautious about — ideally, we’d want to see sentiment weaken before a strong move higher.
There’s also the question of positioning. It has been widely discussed (especially online) that large institutions like JPM inherited significant short exposure between 2008–2025. If true, they may now be neutral or even long — but it’s difficult to verify.
---
### **Was Silver Suppressed?**
In my view, silver was effectively held down for years. It was the last major commodity to break out of its **~45-year range (1980–2025)**.
After breaking out around the low $40s, it surged aggressively toward ~$121, before retracing sharply to roughly half that level.
The key question now:
> Could price be pushed lower again before any sustained move higher?
---
### **The Bigger Picture (200-Year Chart)**
The long-term P&F chart (dating back to the 1800s) shows a remarkably clean **wedge structure** — something very rare over such a long time horizon.
Given that:
* A retest of the long-term **45° bullish trendline** is entirely possible
* That trendline currently aligns around the **$48–$50 zone**
* And if long-term targets are in the **$300–$1000+ range**, a pullback to the breakout zone is not unusual
From a macro perspective, this would simply be:
> Resistance (~$48) turning into support
---
### **Time vs Structure (Important P&F Concept)**
Remember:
P&F charts do **not measure time**, only price reversals.
So before the weekly trendline reaches that $48–$50 level, we could still see:
* 5–6 smaller alternating bull and bear legs
On the **daily chart**, price is already near that level, which gives some hope the bearish setup may fail and price could move higher sooner.
---
### **Macro Risks**
There are a few macro scenarios that could pressure silver:
**1. Oil + Recession Scenario**
* Rising oil prices could trigger recessionary pressure
* Central banks may need liquidity → sell gold
* This could widen the gold/silver ratio and drag silver lower
* Especially if countries need USD to service debt
**2. Dollar Demand via Energy**
* If oil must be purchased in USD
* Countries may need to:
* sell gold/silver
* or exchange assets for dollars
* This could create downward pressure on metals
---
### **Invalidation of Bearish Case**
The bearish setup is invalidated if:
* price closes strongly higher
* or makes a new ATH
In that case, the vertical count flips bullish, with a potential target in the **$224–$229 range**, depending on timing and structure.
---
### **Long-Term View**
Long term, silver still looks very attractive.
* ~$50 → strong accumulation zone
* $35–$37 → extreme opportunity (low probability ~5%)
That lower scenario could occur as a:
> sharp spike low designed to shake out holders and invalidate bullish setups
---
### **Manipulation Angle (Hypothetical)**
If silver has been manipulated in the past, then logically:
* it could be pushed lower again
* even to levels many believe are “impossible”
A drop into the $30s could:
* force capitulation
* flush out physical holders
* occur just before a major multi-year rally
---
### **Key Support Zones**
* **$20–$40 range** → massive historical volume → strong support
* **Low $60s** → attractive accumulation area
* even if broken, unlikely to stay below for long
---
### **Opportunity in Miners**
If silver pulls back:
* silver miners could offer a major opportunity
* previous cycles showed strong outperformance
If price resets:
> the miner trade could potentially be repeated
---
### **Timeframe Approach**
You should look at:
* Daily
* Weekly
* Monthly
Then ask:
> Which chart structure looks the cleanest and most logical?
For me, the **weekly chart** stands out.
* Conservative close-based analysis suggests ~$53
* Other timeframes produce different targets
* A **360° view** is best
---
### **Why Weekly Matters**
Weekly charts:
* reduce noise
* reduce short-term manipulation
* are harder to control than intraday pricing
Holding price below weekly closes consistently is difficult.
---
### **Final Thoughts**
Technical analysis — especially classic P&F — is underrated today. The older generation of analysts were incredibly skilled, and there’s still a lot to learn from them.
If silver continues higher:
* and gold pushes toward extreme levels (e.g. $20k scenario)
* silver could enter a completely different phase
Along the way:
* multiple vertical & horizontal counts will form
* ideally clustering around major targets
---
### **Bottom Line**
* Worst-case scenario: pullback toward $50 (or lower spike $35)
* Best-case scenario: major long-term breakout
If you can manage the downside risk:
> the long-term upside case for silver remains very strong
Cheeky orders in place? just in case it goes that low?

Penafian
Maklumat dan penerbitan adalah tidak bertujuan, dan tidak membentuk, nasihat atau cadangan kewangan, pelaburan, dagangan atau jenis lain yang diberikan atau disahkan oleh TradingView. Baca lebih dalam Terma Penggunaan.
Penafian
Maklumat dan penerbitan adalah tidak bertujuan, dan tidak membentuk, nasihat atau cadangan kewangan, pelaburan, dagangan atau jenis lain yang diberikan atau disahkan oleh TradingView. Baca lebih dalam Terma Penggunaan.