
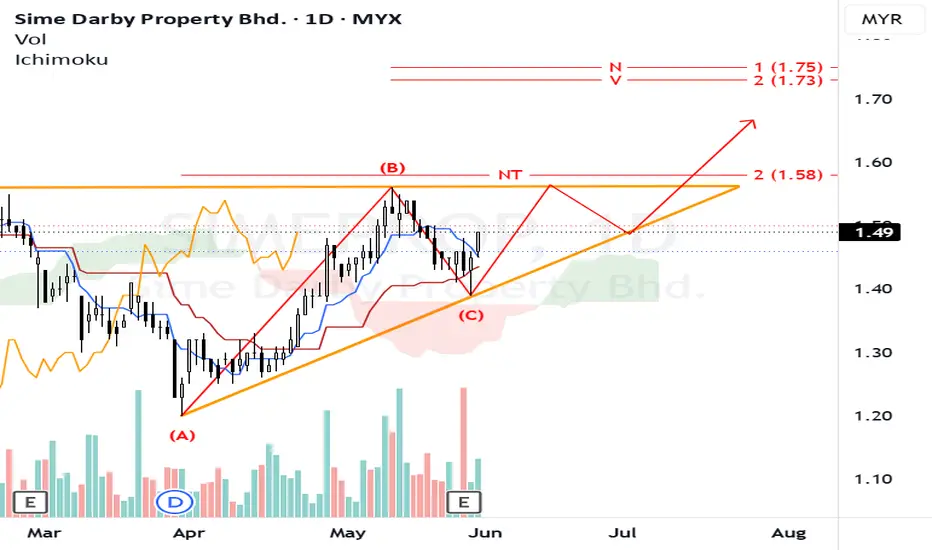
Ichimoku Cloud Posture: Bullish Support
The price is actively trading above the Kumo, confirming that the broader trend remains bullish.
The recent pullback to point (C) perfectly aligned with the top of the Kumo. The Kumo successfully acted as dynamic support, rejecting downward momentum and initiating the current bounce.
Ascending Triangle Pattern: Accumulation Phase
Higher Lows: The solid orange upward-sloping trendline connects the primary swing low at (A) to the recent higher low at (C). This illustrates consistent buying pressure, as market participants are willing to step in at progressively higher prices.
Horizontal Resistance: The top of the triangle is formed by the previous swing high at point (B), resting right around the 1.58 level. The compression between the rising support and this horizontal resistance creates a classic ascending triangle, typically considered a bullish continuation pattern.
N-Wave Projection:
Assuming the projected upside targets
NT - 1.58
V - 1.73
N - 1.75
Price to maintained above NT level to confirm the bullish continuation.
Aggressive/Current Entry: Entering near current prices (1.49) capitalizes on the bounce off the (C) level and the Ichimoku cloud, offering a favorable risk-to-reward ratio before the breakout occurs.
Conservative/Confirmation Entry: Wait for a decisive daily candle close above the horizontal resistance at 1.58 (point B) to confirm the ascending triangle breakout.
Place an SL just below the recent swing low at point (C) and the ascending orange trendline (roughly around the 1.35 level). A break below this structure would invalidate both the ascending triangle and the bullish N-wave pattern, plunging the price back inside the Ichimoku cloud.
The chart looks constructively bullish, with an ascending triangle and bullish Ichimoku structure supporting the view that a break above 1.57–1.58 could trigger an N-wave continuation toward 1.73–1.75.
Notes:
1. Analysis for education purposes only.
2. Trade at your own risk.
The price is actively trading above the Kumo, confirming that the broader trend remains bullish.
The recent pullback to point (C) perfectly aligned with the top of the Kumo. The Kumo successfully acted as dynamic support, rejecting downward momentum and initiating the current bounce.
Ascending Triangle Pattern: Accumulation Phase
Higher Lows: The solid orange upward-sloping trendline connects the primary swing low at (A) to the recent higher low at (C). This illustrates consistent buying pressure, as market participants are willing to step in at progressively higher prices.
Horizontal Resistance: The top of the triangle is formed by the previous swing high at point (B), resting right around the 1.58 level. The compression between the rising support and this horizontal resistance creates a classic ascending triangle, typically considered a bullish continuation pattern.
N-Wave Projection:
Assuming the projected upside targets
NT - 1.58
V - 1.73
N - 1.75
Price to maintained above NT level to confirm the bullish continuation.
Aggressive/Current Entry: Entering near current prices (1.49) capitalizes on the bounce off the (C) level and the Ichimoku cloud, offering a favorable risk-to-reward ratio before the breakout occurs.
Conservative/Confirmation Entry: Wait for a decisive daily candle close above the horizontal resistance at 1.58 (point B) to confirm the ascending triangle breakout.
Place an SL just below the recent swing low at point (C) and the ascending orange trendline (roughly around the 1.35 level). A break below this structure would invalidate both the ascending triangle and the bullish N-wave pattern, plunging the price back inside the Ichimoku cloud.
The chart looks constructively bullish, with an ascending triangle and bullish Ichimoku structure supporting the view that a break above 1.57–1.58 could trigger an N-wave continuation toward 1.73–1.75.
Notes:
1. Analysis for education purposes only.
2. Trade at your own risk.

Penafian
Maklumat dan penerbitan adalah tidak bertujuan, dan tidak membentuk, nasihat atau cadangan kewangan, pelaburan, dagangan atau jenis lain yang diberikan atau disahkan oleh TradingView. Baca lebih dalam Terma Penggunaan.
Penafian
Maklumat dan penerbitan adalah tidak bertujuan, dan tidak membentuk, nasihat atau cadangan kewangan, pelaburan, dagangan atau jenis lain yang diberikan atau disahkan oleh TradingView. Baca lebih dalam Terma Penggunaan.