
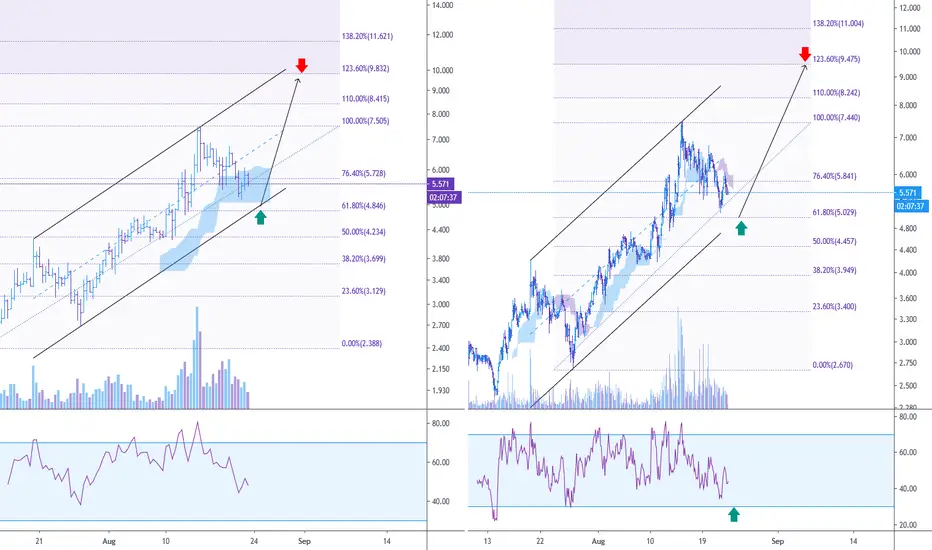
At 12H, the cloud is directing upward, indicating an uptrend. The RSI moved down and the price found support on the Ichimoku cloud .
At H3, the cloud is directing downward, indicating a price correction at the 12H timeframe.
Besides, RSI is at the oversold level, which indicates the weakness of sellers.
We recommend buying SNXUSDT when the RSI reaches the oversold level near the 61.8% Fibonacci level and take the profit near the level of $ 9.
At H3, the cloud is directing downward, indicating a price correction at the 12H timeframe.
Besides, RSI is at the oversold level, which indicates the weakness of sellers.
We recommend buying SNXUSDT when the RSI reaches the oversold level near the 61.8% Fibonacci level and take the profit near the level of $ 9.

Penerbitan berkaitan
Penafian
Maklumat dan penerbitan adalah tidak bertujuan, dan tidak membentuk, nasihat atau cadangan kewangan, pelaburan, dagangan atau jenis lain yang diberikan atau disahkan oleh TradingView. Baca lebih dalam Terma Penggunaan.
Penerbitan berkaitan
Penafian
Maklumat dan penerbitan adalah tidak bertujuan, dan tidak membentuk, nasihat atau cadangan kewangan, pelaburan, dagangan atau jenis lain yang diberikan atau disahkan oleh TradingView. Baca lebih dalam Terma Penggunaan.