
📊 SPARC |
Monthly Chart Analysis
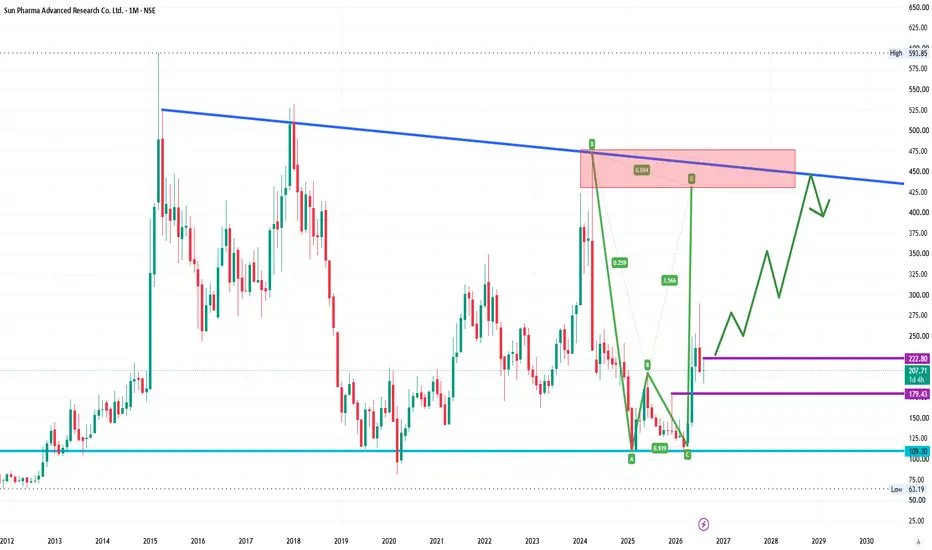
A Potential Bearish Harmonic X-A-B-C-D pattern is developing on the monthly chart.
🔥 Strong Resistance / PRZ: ₹430–₹475
📉 Major Trendline Resistance: ~₹450
🟢 Bullish Scenario
Above ₹225 on a strong monthly close:
🎯 ₹300 → ₹350 → ₹400+
🔴 Bearish Scenario
Rejection from ₹180–₹170 + breakdown:
🎯 ₹140 → ₹100
📌 Current Price: ~₹208
📌 Major Support: ₹100–₹110
📌 Key Decision Zone: ₹430–₹475
The ₹430–₹475 zone is the BIG level to watch.
⚠️ Pattern confirmation is required before taking any trade.
⚠️ Technical analysis only. Not a buy/sell recommendation.
#SPARC #HarmonicPattern #TechnicalAnalysis #NSE #StockMarket #SwingTrading #PriceAction
Monthly Chart Analysis
A Potential Bearish Harmonic X-A-B-C-D pattern is developing on the monthly chart.
🔥 Strong Resistance / PRZ: ₹430–₹475
📉 Major Trendline Resistance: ~₹450
🟢 Bullish Scenario
Above ₹225 on a strong monthly close:
🎯 ₹300 → ₹350 → ₹400+
🔴 Bearish Scenario
Rejection from ₹180–₹170 + breakdown:
🎯 ₹140 → ₹100
📌 Current Price: ~₹208
📌 Major Support: ₹100–₹110
📌 Key Decision Zone: ₹430–₹475
The ₹430–₹475 zone is the BIG level to watch.
⚠️ Pattern confirmation is required before taking any trade.
⚠️ Technical analysis only. Not a buy/sell recommendation.
#SPARC #HarmonicPattern #TechnicalAnalysis #NSE #StockMarket #SwingTrading #PriceAction

Penafian
Maklumat dan penerbitan adalah tidak bertujuan, dan tidak membentuk, nasihat atau cadangan kewangan, pelaburan, dagangan atau jenis lain yang diberikan atau disahkan oleh TradingView. Baca lebih dalam Terma Penggunaan.
Penafian
Maklumat dan penerbitan adalah tidak bertujuan, dan tidak membentuk, nasihat atau cadangan kewangan, pelaburan, dagangan atau jenis lain yang diberikan atau disahkan oleh TradingView. Baca lebih dalam Terma Penggunaan.