
SPCX: Breakout Structure & Liquidity Target
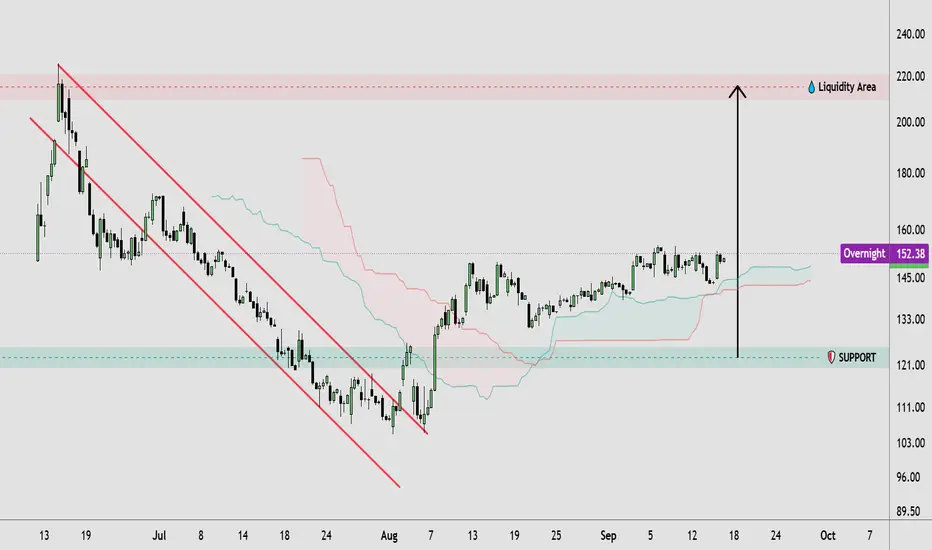
🔹 SPCX price action shows a recovery from the previous descending structure, with price breaking above the falling trendline and developing a series of higher lows. The market has since entered a consolidation phase around the 145–155 area, while the 121–125 region remains a key support zone. Above the current structure, the 215–220 area is highlighted as a major liquidity region and potential resistance.
🔸 If SPCX maintains its structure above the highlighted support, price could continue developing toward higher resistance and the overhead liquidity area, particularly if a breakout above recent highs is confirmed. Traders may wait for price confirmation before considering any trade. If the key support zone fails, the bullish structure could weaken and price might revisit lower levels before establishing a new direction. This technical analysis focuses on SPCX price action, market structure, breakout, support, resistance, and liquidity.
This analysis is for educational purposes only and does not constitute financial or investment advice. Always conduct your own research before making trading decisions.
🔸 If SPCX maintains its structure above the highlighted support, price could continue developing toward higher resistance and the overhead liquidity area, particularly if a breakout above recent highs is confirmed. Traders may wait for price confirmation before considering any trade. If the key support zone fails, the bullish structure could weaken and price might revisit lower levels before establishing a new direction. This technical analysis focuses on SPCX price action, market structure, breakout, support, resistance, and liquidity.
This analysis is for educational purposes only and does not constitute financial or investment advice. Always conduct your own research before making trading decisions.
Dagangan aktif

📲 Join Our Telegram Community
t.me/+zoOewsc0ee43ZDc8
t.me/+zoOewsc0ee43ZDc8
Penerbitan berkaitan
Penafian
Maklumat dan penerbitan adalah tidak bertujuan, dan tidak membentuk, nasihat atau cadangan kewangan, pelaburan, dagangan atau jenis lain yang diberikan atau disahkan oleh TradingView. Baca lebih dalam Terma Penggunaan.
📲 Join Our Telegram Community
t.me/+zoOewsc0ee43ZDc8
t.me/+zoOewsc0ee43ZDc8
Penerbitan berkaitan
Penafian
Maklumat dan penerbitan adalah tidak bertujuan, dan tidak membentuk, nasihat atau cadangan kewangan, pelaburan, dagangan atau jenis lain yang diberikan atau disahkan oleh TradingView. Baca lebih dalam Terma Penggunaan.