
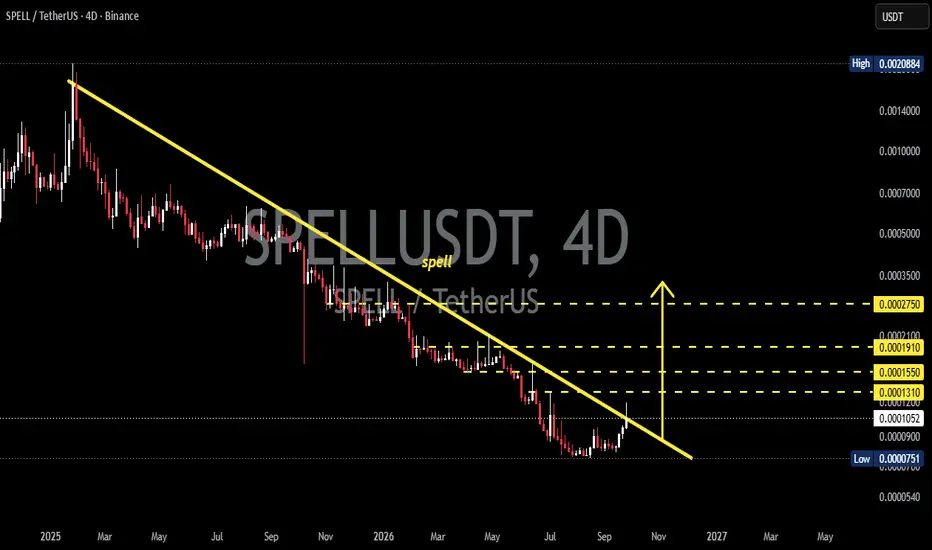
Pair:  SPELL / USDT
Time Frame: 4D
Exchange: Binance
Pattern: 📉 Descending Trendline
Current Area: Around 0.0001056
---
📉 Pattern Description — Descending Trendline
SPELL/USDT remains within a long-term downtrend, characterized by the yellow Descending Trendline.
🔻 The trendline is formed by connecting several Lower Highs, indicating that previous price rallies have continued to face selling pressure from sellers.
However, the latest price action shows that the price is beginning to consolidate near the lower part of the structure, while the candles are gradually approaching the Descending Trendline.
⚠️ This area is important because if the price successfully breaks above the trendline with strong confirmation, the long-term bearish structure could potentially begin to change.
---
🟢 Bullish Scenario — Descending Trendline Breakout
🚀 Main trigger: Price successfully breaks out and closes a 4D candle above the Descending Trendline.
If the breakout is confirmed, the resistance levels shown on the chart could become potential targets:
🎯 Target 1: 0.0001310
🎯 Target 2: 0.0001550
🎯 Target 3: 0.0001910
🎯 Target 4: 0.0002750
📈 A breakout above the trendline would indicate that bearish pressure is beginning to weaken.
🔄 After the breakout, an ideal scenario would be a retest of the trendline, followed by the price successfully holding above it. A successful retest could provide additional confirmation that the previous resistance has turned into support.
---
🔴 Bearish Scenario — Rejection from the Trendline
⚠️ If SPELL/USDT fails to break above the Descending Trendline and receives a rejection, bearish pressure could continue.
📉 A failed breakout could send the price back toward the nearest support areas:
🔹 0.0001056 — Current price area shown on the chart
🔹 0.0000900 — Near-term support
🔹 0.0000751 — Visible Low / major support area
💥 If 0.0000751 is decisively broken with strong selling pressure, the bearish structure could potentially continue toward lower levels.
---
⚖️ Key Levels
🟡 0.0001310 → Resistance / Target 1
🟡 0.0001550 → Resistance / Target 2
🟡 0.0001910 → Resistance / Target 3
🟡 0.0002750 → Major Resistance / Target 4
⚪ 0.0001056 → Current price area shown on the chart
🔻 0.0000900 → Near-term support
🔻 0.0000751 → Major Low / Important Support
---
🔍 Conclusion
📌 SPELL/USDT is approaching an important area beneath the Descending Trendline.
🟢 Bullish: A breakout followed by a confirmed 4D candle close above the trendline, with the price holding the breakout/retest area, could open the way toward 0.0001310 → 0.0001550 → 0.0001910 → 0.0002750.
🔴 Bearish: Rejection from the trendline could lead to another test of 0.0000900 and potentially 0.0000751.
🎯 Key confirmation level: Descending Trendline.
📊 Until a confirmed breakout occurs, the existing downtrend structure remains important to monitor.
⚠️ Note: This analysis is based on the 4D chart structure and is not a guarantee of future price movement. Always use proper risk management and conduct your own research (DYOR).
#SPELL #SPELLUSDT #Crypto
SPELL / USDTTime Frame: 4D
Exchange: Binance
Pattern: 📉 Descending Trendline
Current Area: Around 0.0001056
---
📉 Pattern Description — Descending Trendline
SPELL/USDT remains within a long-term downtrend, characterized by the yellow Descending Trendline.
🔻 The trendline is formed by connecting several Lower Highs, indicating that previous price rallies have continued to face selling pressure from sellers.
However, the latest price action shows that the price is beginning to consolidate near the lower part of the structure, while the candles are gradually approaching the Descending Trendline.
⚠️ This area is important because if the price successfully breaks above the trendline with strong confirmation, the long-term bearish structure could potentially begin to change.
---
🟢 Bullish Scenario — Descending Trendline Breakout
🚀 Main trigger: Price successfully breaks out and closes a 4D candle above the Descending Trendline.
If the breakout is confirmed, the resistance levels shown on the chart could become potential targets:
🎯 Target 1: 0.0001310
🎯 Target 2: 0.0001550
🎯 Target 3: 0.0001910
🎯 Target 4: 0.0002750
📈 A breakout above the trendline would indicate that bearish pressure is beginning to weaken.
🔄 After the breakout, an ideal scenario would be a retest of the trendline, followed by the price successfully holding above it. A successful retest could provide additional confirmation that the previous resistance has turned into support.
---
🔴 Bearish Scenario — Rejection from the Trendline
⚠️ If SPELL/USDT fails to break above the Descending Trendline and receives a rejection, bearish pressure could continue.
📉 A failed breakout could send the price back toward the nearest support areas:
🔹 0.0001056 — Current price area shown on the chart
🔹 0.0000900 — Near-term support
🔹 0.0000751 — Visible Low / major support area
💥 If 0.0000751 is decisively broken with strong selling pressure, the bearish structure could potentially continue toward lower levels.
---
⚖️ Key Levels
🟡 0.0001310 → Resistance / Target 1
🟡 0.0001550 → Resistance / Target 2
🟡 0.0001910 → Resistance / Target 3
🟡 0.0002750 → Major Resistance / Target 4
⚪ 0.0001056 → Current price area shown on the chart
🔻 0.0000900 → Near-term support
🔻 0.0000751 → Major Low / Important Support
---
🔍 Conclusion
📌 SPELL/USDT is approaching an important area beneath the Descending Trendline.
🟢 Bullish: A breakout followed by a confirmed 4D candle close above the trendline, with the price holding the breakout/retest area, could open the way toward 0.0001310 → 0.0001550 → 0.0001910 → 0.0002750.
🔴 Bearish: Rejection from the trendline could lead to another test of 0.0000900 and potentially 0.0000751.
🎯 Key confirmation level: Descending Trendline.
📊 Until a confirmed breakout occurs, the existing downtrend structure remains important to monitor.
⚠️ Note: This analysis is based on the 4D chart structure and is not a guarantee of future price movement. Always use proper risk management and conduct your own research (DYOR).
#SPELL #SPELLUSDT #Crypto

✅ Get Free Signals! Join Our Telegram Channel Here: t.me/TheCryptoNuclear
✅ Twitter: twitter.com/crypto_nuclear
✅ Join Bybit : partner.bybit.com/b/nuclearvip
✅ Benefits : Lifetime Trading Fee Discount -50%
✅ Twitter: twitter.com/crypto_nuclear
✅ Join Bybit : partner.bybit.com/b/nuclearvip
✅ Benefits : Lifetime Trading Fee Discount -50%
Penafian
Maklumat dan penerbitan adalah tidak bertujuan, dan tidak membentuk, nasihat atau cadangan kewangan, pelaburan, dagangan atau jenis lain yang diberikan atau disahkan oleh TradingView. Baca lebih dalam Terma Penggunaan.