
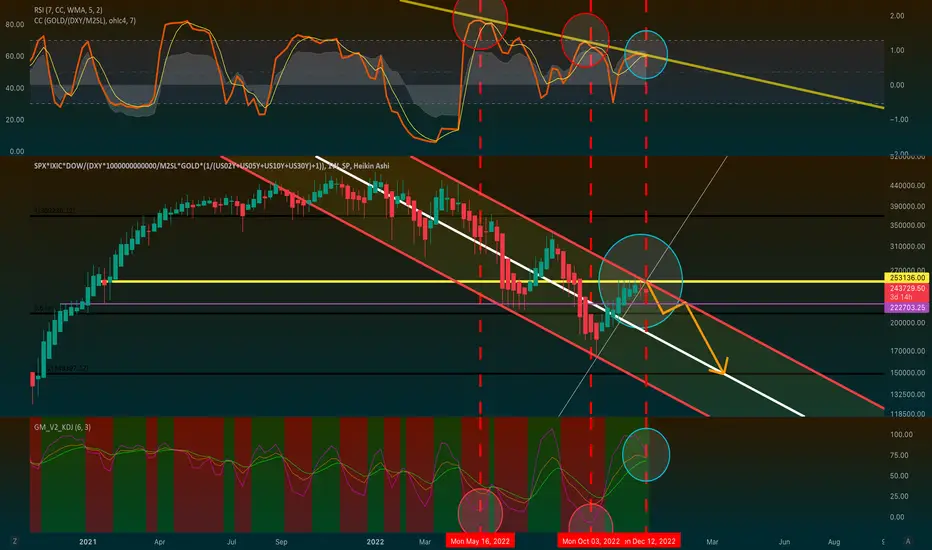
The assumption of an inverse relationship between the gold and stocks implies a negative correlation coefficient. KDJ (bottom) and CC (top) had inverse peaks and troughs in those circled periods. This time (blue circle) the two indicators aligned to fall. KDJ predicting the downfall of stocks may confirm the market equilibrium resetting. Moreover, the graph presented (explained below) displays a bounce from the significant red resistance.
Graph:
(SPX*IXIC*DOW)/(TVC:DXY*1000000000000/M2SL*TVC:GOLD*(1/(TVC:US02Y+TVC:US05Y+TVC:US10Y+TVC:US30Y)+1))
= (SPX * IXIC * DOW) / (DXY/USM2 * GOLD * U.S BONDS)
= (American Indices) / (Recession-proof Assets)
Graph:
(SPX*IXIC*DOW)/(TVC:DXY*1000000000000/M2SL*TVC:GOLD*(1/(TVC:US02Y+TVC:US05Y+TVC:US10Y+TVC:US30Y)+1))
= (SPX * IXIC * DOW) / (DXY/USM2 * GOLD * U.S BONDS)
= (American Indices) / (Recession-proof Assets)

Penafian
Maklumat dan penerbitan adalah tidak bertujuan, dan tidak membentuk, nasihat atau cadangan kewangan, pelaburan, dagangan atau jenis lain yang diberikan atau disahkan oleh TradingView. Baca lebih dalam Terma Penggunaan.
Penafian
Maklumat dan penerbitan adalah tidak bertujuan, dan tidak membentuk, nasihat atau cadangan kewangan, pelaburan, dagangan atau jenis lain yang diberikan atau disahkan oleh TradingView. Baca lebih dalam Terma Penggunaan.