
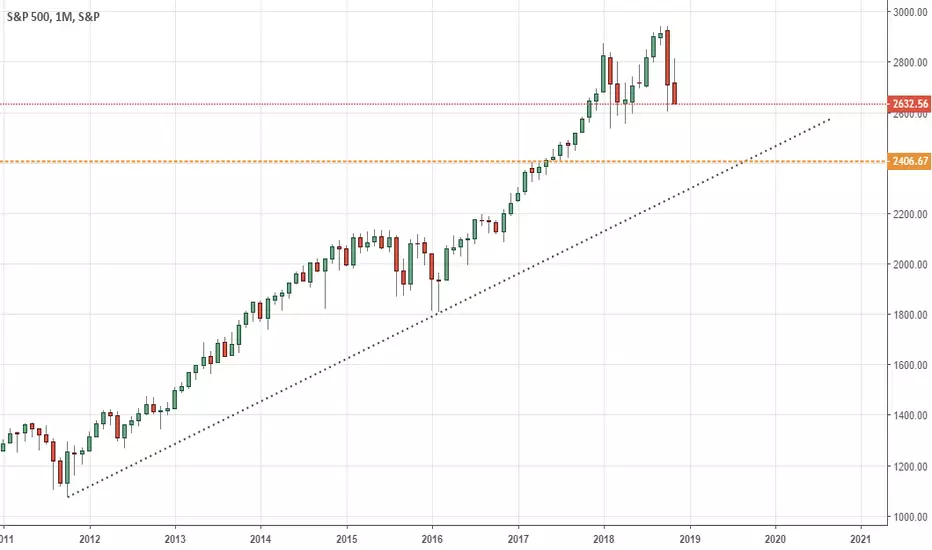
We are looking at a long-term chart that will tell us a lot of information that corresponds to the world economy.
Pay attention to the highlighted areas for a bounce or break!

We will keep an eye on the 2.400 AREA should the price break down further.
* the area with the most momentum is currently the short side because the US economy is fundamentally slowing down at the moment.
For more information:
drive.google.com/open?id=1zkulMZ22W4DY5r7hzHPgkADqMnlUnQ2d
Pay attention to the highlighted areas for a bounce or break!
We will keep an eye on the 2.400 AREA should the price break down further.
* the area with the most momentum is currently the short side because the US economy is fundamentally slowing down at the moment.
For more information:
drive.google.com/open?id=1zkulMZ22W4DY5r7hzHPgkADqMnlUnQ2d
Nota
Coming for the retest

Penafian
Maklumat dan penerbitan adalah tidak bertujuan, dan tidak membentuk, nasihat atau cadangan kewangan, pelaburan, dagangan atau jenis lain yang diberikan atau disahkan oleh TradingView. Baca lebih dalam Terma Penggunaan.
Penafian
Maklumat dan penerbitan adalah tidak bertujuan, dan tidak membentuk, nasihat atau cadangan kewangan, pelaburan, dagangan atau jenis lain yang diberikan atau disahkan oleh TradingView. Baca lebih dalam Terma Penggunaan.