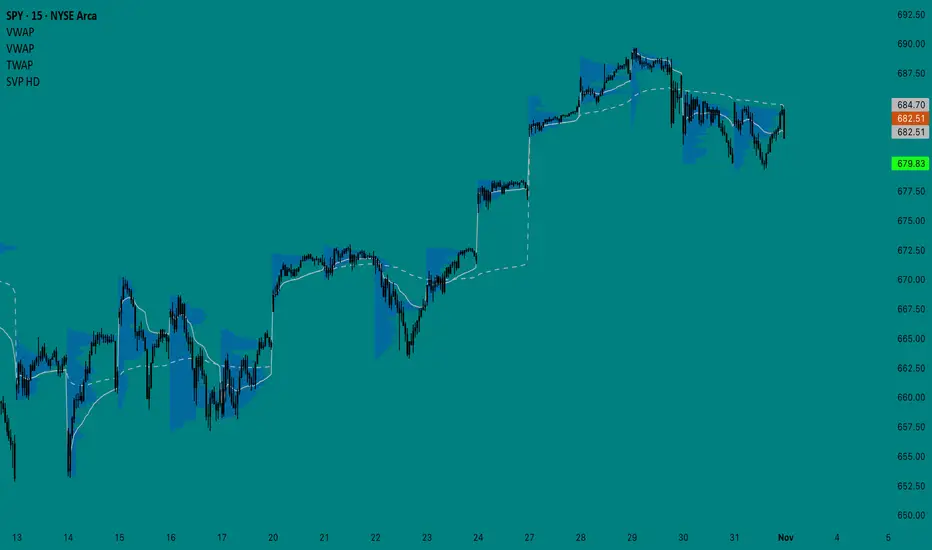
The market has been showing no signs of slowing down as of late. Every dip is being aggressively bought and fear hedging of SPX puts and Gold is appearing to be providing more liquidity to keep prices moving higher. I posted this in Minds earlier and will add because it sums up my assessment of where the market is currently at and it’s potential achilles’ heel.
“The US will continue to have one of the most stable market environments compared to the rest of the world, making it a safe place to store capital. While the trade deficit gives the US some leverage over China when it comes to trade, the fact that China is the #3 foreign holder of US debt gives them the “trump card” in the trade war.
Rate cuts will continue to be stimulative and help keep the Fed’s interest payments from getting out of control (for now) but things can quickly unravel if yields start rising to the point where it forces the Fed back into QE prematurely.
This is why Trump keeps backing down from the most extreme measures in the trade war. He knows US companies cannot withstand 100%+ tariffs and China could stop buying Treasuries and start pushing yields higher. This is why I keep an eye on MOVE when there is stock market volatility to make sure there isn’t growing institutional hedging of Treasuries.
I still need to look everything over to determine my bias for this week but with the trade war entering what I think will be a temporary phase of relief, I’m not seeing strong bearish fundamentals at this point in time.”
Here is what I’m seeing for the week ahead.
+-+-+-+-+-+-+-+-+-+-+-+-+-+-+-+-+-+-+-+-+-+-+-+-+-+-+-+-+-+-+-+-+-+-+-+-+-+-+-+-+-+-

1. Macro
The dollar DXY is reaching the top of its range and the hollow candles have been less than bullish, so I think the index may once again peak around 100 before reverting back to the average. I am keeping this in mind when comparing other assets to the dollar.
The US03MY / US10Y yield spread is once again quite wide, which was recently driven by a rise in the 10Y yield while the 3M yield mostly remained flat, as I suspected would happen in my previous post. The overall trend for both is still slanting downward, so while it’s never great to see the 10Y yield rising, the wider spread is healthier to see. On the contrary, DFII10 (inflation-indexed 10Y bond) went up on the last available date, Thursday 10/30, so it will be important to watch the Forward Inflation Gauge (bottom right) to see if the market starts to send any inflation signals.
I have updated the formula for the inflation gauge as well to broaden the scope. The new formula is
= US03MY*0.25+US10Y*0.50+US30Y*0.25-DFII10
I decided to include theUS30Y bond since its yield is of the biggest concern to policymakers and weight the average to place the most significance on the 10Y yield. As the shutdown continues, the Fed will be placed in an increasingly difficult position without official data. Since PCE was not published on Friday, this is depriving us of a key piece of data that would show if the market is correct in pricing in lower inflation or if the spread between Real/Implied inflation will continue to widen. This is why yields will yields will provide important clues, especially if the shutdown starts nearing an end. If real employment and inflation data will be released soon after, will the market begin to sell bonds due to lack in confidence or continue the course?
Next on commodities, GOLD is sitting on its average level and could go either way from here. I’d expect a retracement higher but who knows. As I mentioned above, if the dollar DXY starts to revert lower, it could help Gold move back up a few points. I’m not expecting much out of Gold for at least another week. It will be interesting to see what happens with Oil and Commodities (bottom right) this week in relation to the dollar index. If for whatever reason, the dollar rallies, it could push oil and ag/metal commodities down, but the alternative may be of greater concern: if the Dollar moves lower again, commodities could surge well above the average in correlation which could be perceived as inflationary since the rise in prices (especially when it comes to copper) has more to do with US trade policy rather than pure international demand. I read earlier today in The Economist that Copper is trading at a higher spot price on the New York exchange compared to London, so to summarize, I will be watching the Macro chart very closely this week, as I think important signals are on the horizon.

2. FX
Other currency indices continuing to fall will help bolster the dollar’s relative standing, so it will be important to keep an eye on this as well as the week unfolds for clues on the Dollar, which in turn will have an effect on commodities. I have the bond yields indexed to 100 again here to show the change and as I mentioned in the introduction, the 3M chart (top) shows how investors are much calmer on the US in the short term compared to other countries. 10Y bonds rose across the board at the end of October but seem to be leveling off.

3. Risk
I don’t draw on my charts as much these days but I think there are some interesting points on this layout that I want to illustrate. First, on the corporate bond yield premium spread (high yield - investment grade) the most recent data (Thursday 10/30) shows the spread went up, which could potentially be a higher low. It will be important to watch this and, to a lesser degree, HHYG/LQD (for intraday) for signals of stress in credit markets.
Next, I still believe the EES1!/GOLD chart shows the spread found a bottom, so even if Gold gains on ES this week, I think gold’s preference over stocks may continue to decline. Another important development last week was how SPY broke out of the rising channel over
  RSP (equal weighted ETF) and held on Friday. As you can see on the bottom chart,
  NDQ outperformed the other indices quite well, so I take this as a signal of extreme demand for Tech and other mega-cap stocks that are weighted the highest.
Takeaway: Keep an eye on corporate credit but unless there is a significant change, stocks look biased in favor of Tech and other mega caps.

4. Sector Bias
Tech ( XLK) has been moving up against
  SPX since the end of October, so the risk appetite is continuing to grow. As I mentioned about SSPY/RSP , this supports that the highest weighted stocks will continue to outperform.

5. Futures Bias
There was some bearish intraday activity on Futures at the end of last week, especially on Friday, where Realized Volatility increased and institutions hedged by buying SPX puts (VIX) and VIX calls ( VVIX), PPCSPX was quote high, however there was divergence with VIX, so the weighted index so the institutional interest may have been lower than what the weighted index was indicating.
On the right side, you can see the CVD momentum was in a downtrend from Wednesday-Friday which reacted ahead of the ES price and captured a maximum 1.46% decline
Lastly, I have switched back to Renko from Line Break, as I think the ATR calculation provides better noise filtering while being more reactive to fast changes. Here you can see that the price could not reclaim weekly VWAP (dotted line) Thursday or Friday, so sellers were in control those days and dealers bought into the volatility. It also looks like the price tried to form a range and failed, causing it to slide lower. Right now it will be important to see which way the price goes. If it retraces higher, will it make a new ATH or fail to do so? That could be an important signal to gauge how much strength buyers still have.
Conclusion:
Out of all the charts, I would say that if I were to view the ES chart in isolation I would probably have a bearish bias, and beyond the chart there are developing macro signals that could provide support to the bearish fundamental case (commodity rally, rising corporate credit spreads, dealers short gamma) that will be important to watch for signs of continuation. On the flip side, if I were to view every chart excluding ES, I would say this environment could still support continued upside for the indices (ES1!/Gold spread, the weighted index outperforming unweighted,XLK pivot, and low Treasury volatility MOVE).
I think this juxtaposition illustrates that the market is uncertain as well. Macro indicators are at what may be an inflection point, so the fear hedging after the 10/22 to 10/30 rally is justifiable since stock market performance will likely be greatly influenced by Macro forces if anything changes. It also seems like arguments can be made that the Dollar rising or falling this week (especially if it’s quick) could have negative ripple effects in the markets this week. I believe the worst case for stocks this week would be a dollar sell off.
For these reasons, it would be reckless to be anything but Neutral here. I’d prefer to play the bull side if it seems like volatility will “unwind”, but if the market seems like it’s going to keep buying into Volatility, I will expect to see lower prices across the indices.
Regardless of what happens this week, I do think SPX hitting 7k this year is all but inevitable, so if I do take a bearish bias, it will be for the short term and will be reassessed on a daily basis. Let me know what you think and thanks for reading.
“The US will continue to have one of the most stable market environments compared to the rest of the world, making it a safe place to store capital. While the trade deficit gives the US some leverage over China when it comes to trade, the fact that China is the #3 foreign holder of US debt gives them the “trump card” in the trade war.
Rate cuts will continue to be stimulative and help keep the Fed’s interest payments from getting out of control (for now) but things can quickly unravel if yields start rising to the point where it forces the Fed back into QE prematurely.
This is why Trump keeps backing down from the most extreme measures in the trade war. He knows US companies cannot withstand 100%+ tariffs and China could stop buying Treasuries and start pushing yields higher. This is why I keep an eye on
MOVE when there is stock market volatility to make sure there isn’t growing institutional hedging of Treasuries.I still need to look everything over to determine my bias for this week but with the trade war entering what I think will be a temporary phase of relief, I’m not seeing strong bearish fundamentals at this point in time.”
Here is what I’m seeing for the week ahead.
+-+-+-+-+-+-+-+-+-+-+-+-+-+-+-+-+-+-+-+-+-+-+-+-+-+-+-+-+-+-+-+-+-+-+-+-+-+-+-+-+-+-
1. Macro
The dollar
DXY is reaching the top of its range and the hollow candles have been less than bullish, so I think the index may once again peak around 100 before reverting back to the average. I am keeping this in mind when comparing other assets to the dollar. The
US03MY / US10Y yield spread is once again quite wide, which was recently driven by a rise in the 10Y yield while the 3M yield mostly remained flat, as I suspected would happen in my previous post. The overall trend for both is still slanting downward, so while it’s never great to see the 10Y yield rising, the wider spread is healthier to see. On the contrary, DFII10 (inflation-indexed 10Y bond) went up on the last available date, Thursday 10/30, so it will be important to watch the Forward Inflation Gauge (bottom right) to see if the market starts to send any inflation signals. I have updated the formula for the inflation gauge as well to broaden the scope. The new formula is
= US03MY*0.25+US10Y*0.50+US30Y*0.25-DFII10
I decided to include the
US30Y bond since its yield is of the biggest concern to policymakers and weight the average to place the most significance on the 10Y yield. As the shutdown continues, the Fed will be placed in an increasingly difficult position without official data. Since PCE was not published on Friday, this is depriving us of a key piece of data that would show if the market is correct in pricing in lower inflation or if the spread between Real/Implied inflation will continue to widen. This is why yields will yields will provide important clues, especially if the shutdown starts nearing an end. If real employment and inflation data will be released soon after, will the market begin to sell bonds due to lack in confidence or continue the course?Next on commodities,
GOLD is sitting on its average level and could go either way from here. I’d expect a retracement higher but who knows. As I mentioned above, if the dollar DXY starts to revert lower, it could help Gold move back up a few points. I’m not expecting much out of Gold for at least another week. It will be interesting to see what happens with Oil and Commodities (bottom right) this week in relation to the dollar index. If for whatever reason, the dollar rallies, it could push oil and ag/metal commodities down, but the alternative may be of greater concern: if the Dollar moves lower again, commodities could surge well above the average in correlation which could be perceived as inflationary since the rise in prices (especially when it comes to copper) has more to do with US trade policy rather than pure international demand. I read earlier today in The Economist that Copper is trading at a higher spot price on the New York exchange compared to London, so to summarize, I will be watching the Macro chart very closely this week, as I think important signals are on the horizon. 2. FX
Other currency indices continuing to fall will help bolster the dollar’s relative standing, so it will be important to keep an eye on this as well as the week unfolds for clues on the Dollar, which in turn will have an effect on commodities. I have the bond yields indexed to 100 again here to show the change and as I mentioned in the introduction, the 3M chart (top) shows how investors are much calmer on the US in the short term compared to other countries. 10Y bonds rose across the board at the end of October but seem to be leveling off.
3. Risk
I don’t draw on my charts as much these days but I think there are some interesting points on this layout that I want to illustrate. First, on the corporate bond yield premium spread (high yield - investment grade) the most recent data (Thursday 10/30) shows the spread went up, which could potentially be a higher low. It will be important to watch this and, to a lesser degree, HHYG/LQD (for intraday) for signals of stress in credit markets.
Next, I still believe the EES1!/GOLD chart shows the spread found a bottom, so even if Gold gains on ES this week, I think gold’s preference over stocks may continue to decline. Another important development last week was how
SPY broke out of the rising channel over RSP (equal weighted ETF) and held on Friday. As you can see on the bottom chart, NDQ outperformed the other indices quite well, so I take this as a signal of extreme demand for Tech and other mega-cap stocks that are weighted the highest. Takeaway: Keep an eye on corporate credit but unless there is a significant change, stocks look biased in favor of Tech and other mega caps.
4. Sector Bias
Tech (
XLK) has been moving up against SPX since the end of October, so the risk appetite is continuing to grow. As I mentioned about SSPY/RSP , this supports that the highest weighted stocks will continue to outperform. 5. Futures Bias
There was some bearish intraday activity on Futures at the end of last week, especially on Friday, where Realized Volatility increased and institutions hedged by buying SPX puts (
VIX) and VIX calls (VVIX), PPCSPX was quote high, however there was divergence with VIX, so the weighted index so the institutional interest may have been lower than what the weighted index was indicating. On the right side, you can see the CVD momentum was in a downtrend from Wednesday-Friday which reacted ahead of the ES price and captured a maximum 1.46% decline
Lastly, I have switched back to Renko from Line Break, as I think the ATR calculation provides better noise filtering while being more reactive to fast changes. Here you can see that the price could not reclaim weekly VWAP (dotted line) Thursday or Friday, so sellers were in control those days and dealers bought into the volatility. It also looks like the price tried to form a range and failed, causing it to slide lower. Right now it will be important to see which way the price goes. If it retraces higher, will it make a new ATH or fail to do so? That could be an important signal to gauge how much strength buyers still have.
Conclusion:
Out of all the charts, I would say that if I were to view the ES chart in isolation I would probably have a bearish bias, and beyond the chart there are developing macro signals that could provide support to the bearish fundamental case (commodity rally, rising corporate credit spreads, dealers short gamma) that will be important to watch for signs of continuation. On the flip side, if I were to view every chart excluding ES, I would say this environment could still support continued upside for the indices (ES1!/Gold spread, the weighted index outperforming unweighted,
XLK pivot, and low Treasury volatility MOVE). I think this juxtaposition illustrates that the market is uncertain as well. Macro indicators are at what may be an inflection point, so the fear hedging after the 10/22 to 10/30 rally is justifiable since stock market performance will likely be greatly influenced by Macro forces if anything changes. It also seems like arguments can be made that the Dollar rising or falling this week (especially if it’s quick) could have negative ripple effects in the markets this week. I believe the worst case for stocks this week would be a dollar sell off.
For these reasons, it would be reckless to be anything but Neutral here. I’d prefer to play the bull side if it seems like volatility will “unwind”, but if the market seems like it’s going to keep buying into Volatility, I will expect to see lower prices across the indices.
Regardless of what happens this week, I do think SPX hitting 7k this year is all but inevitable, so if I do take a bearish bias, it will be for the short term and will be reassessed on a daily basis. Let me know what you think and thanks for reading.

Penafian
Maklumat dan penerbitan adalah tidak bertujuan, dan tidak membentuk, nasihat atau cadangan kewangan, pelaburan, dagangan atau jenis lain yang diberikan atau disahkan oleh TradingView. Baca lebih dalam Terma Penggunaan.
Penafian
Maklumat dan penerbitan adalah tidak bertujuan, dan tidak membentuk, nasihat atau cadangan kewangan, pelaburan, dagangan atau jenis lain yang diberikan atau disahkan oleh TradingView. Baca lebih dalam Terma Penggunaan.